I seek Alpha in overlooked corners of the market. Such ideas include the looming uranium deficit, litigation finance, and the resurgence of Latin America (LATAM).
I firmly believe that LATAM has enormous growth potential. Its GDP represents 6% of the global GDP, while its stock market capitalization is only 1%. Cliché postulates investing in South America is too dangerous, and I largely agree. However, there are more pieces to the puzzle. Measuring risk is a complex exercise with many variables.
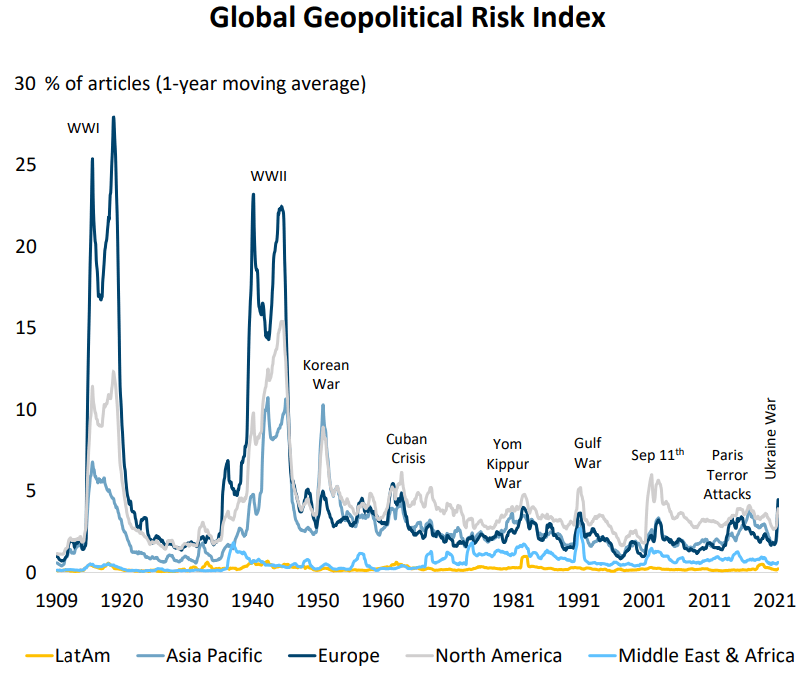
LATAM countries are characterized by political and economic risks, which are usually above the world average. At the same time, South America is the continent with the lowest geopolitical risk.
The yellow line represents South America’s geopolitical risk. It has remained persistently low despite all the crises over the past 100 years. The last war on the continent was the War of the Triple Alliance more than 150 years ago. I don't count the Falklands War because one of the belligerents was not from South America. Over the past decades, there have been occasional border frictions between Colombia and Venezuela, but these were quickly resolved.
In today's South America publication, I analyze the region as an investment opportunity through economic, demographic, and financial lenses. Finally, I share one industry with tremendous investment potential.
Core periphery
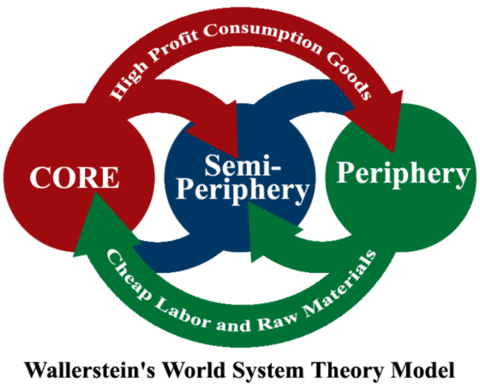
The world is still unipolar, with a core and a periphery. The image below graphically illustrates this macroeconomic concept.
Both elements have characteristics that predetermine their role. The converse is also true, that the role predetermines the characteristics. The global world is not a closed system with a finite number of known variables. Instead, it is an open system with almost infinite inputs. On top of that, systems components follow multidimensional interaction patterns. Despite the complexity of the global economy, it has two primary elements.
Core (Developed markets) - concentrate political, economic, and cultural power globally; aging and declining populations; net importers of raw materials and net exporters of high value-added goods and services.
Semi-periphery and periphery (Emerging and frontier markets) - politically, economically, and culturally dependent on the core; young and growing populations; net exporters of raw materials; net importers of high value-added goods and services.
Model postulate: capital moves bidirectionally between the core and the periphery, following the cyclicality of the global economy.
Purpose: find regions with potential and follow the direction of capital. Growing investments herald growth in the beneficiary region.
Based on this model, South America has excellent investment potential precisely because it is peripheral. It has solid demographics and vast natural resources and is among the largest exporters of raw materials. The core and parts of the periphery have a growing need for South American commodities. This means that more and more capital will flow to the region.
Following the core-to-periphery principle, regions like South America are transforming into semi-periphery/semi-core. A growing part of their population has crossed the poverty line and is climbing the S curve. In other words, it will consume more and more raw materials to meet its needs.
The S-shaped wealth curve
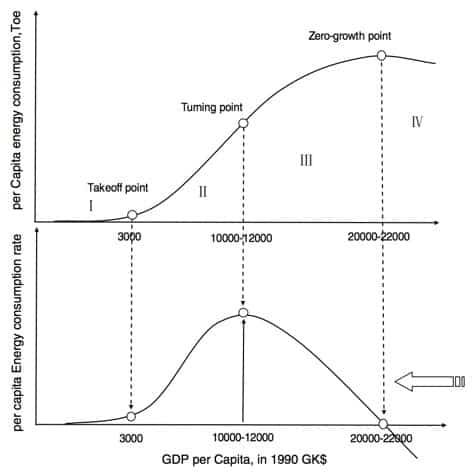
GDP growth and energy demand follow an S-shaped pattern, as shown in the graph below.
A more affluent population means growing energy demand, which does not follow a linear function. The upper half of the graph shows the change in the absolute amount of energy consumed, while the lower half represents the rate of change.
This process has three critical points that mark the phase transition in the country's development.
Point 1 takeoff point - energy consumption is accelerating.
Turning point 2 - after this point, the amount of energy consumed continues to grow, but the growth rate declines.
Point 3: The zero growth point denotes a mature economy where the amount of energy consumed has peaked, and its growth rate is falling even further.
Model postulate: crossing the tipping point between $2,300 and $3,300 (inflation-adjusted $3,500-4,000) GDP per person means that energy and commodity consumption will grow exponentially.
Purpose: forecasting long-term commodities demand. The larger the population of the countries crossing this threshold, the greater the demand.
The following countries with large populations are between points one and two, i.e., on the threshold of this transition:
• India (second most populous country) - 2230 USD per capita
• Indonesia (fourth most populous country) - 4577 USD per capita
• Nigeria (sixth most populous country) - 2523 USD per capita
Indonesia and Nigeria cannot complain about the lack of natural resources, especially oil and base metals. India is one of the largest agricultural producers; however, considering its vast population, it imports colossal quantities of fossil fuels. It is no coincidence that the largest oil refinery is in Gujarat. These three countries will permanently impact the demand for the many raw materials that are available in abundance in Latin America.
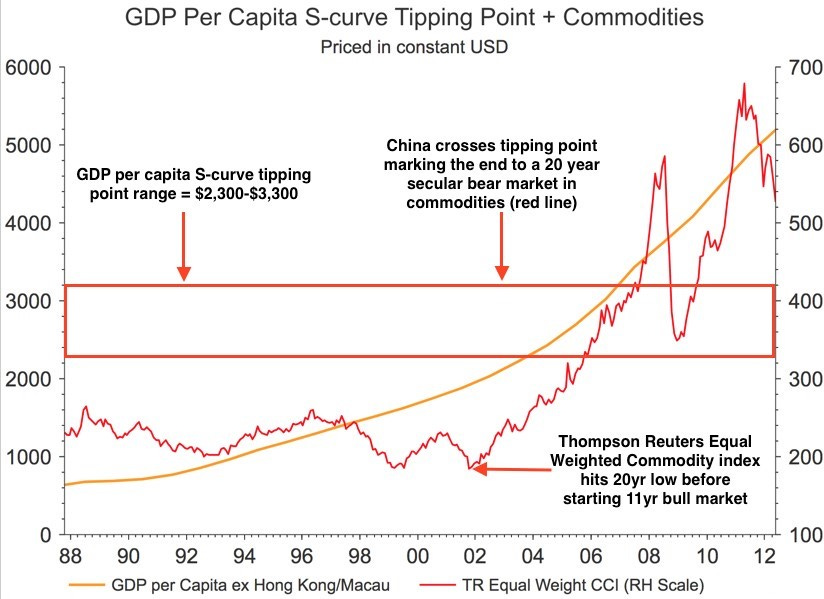
The following chart illustrates what happened to commodities after China crossed the critical GDP per capita threshold in 2004-2008.
Since Deng Xiaoping's reforms, China has registered record economic growth. In 2002, China became a member of the World Trade Organization. The yellow line shows China's GDP, and the red is the Reuters Commodity Index. The latter had already started to appreciate a little before 2002; however, the appreciation rate increased significantly once China passed the GDP threshold.
China is the engine behind the last commodity's extensive bull run. One of the primary beneficiaries of those dynamics was Latin America. In less than a decade, many of the countries in the region have achieved exceptional economic results.
Resources
A one-sentence macro thesis: Latin America has exceptional assets on its balance sheet, carries the lowest geopolitical risk, and is still profoundly undervalued by the market. The following chart from McKinsey represents the continent's assets.
South America has enough energy resources to be energy independent, not only in a fossil fuel-based economy but also in a clean energy economy. The latter needs mind-boggling quantities of copper, lithium, and rare earth metals. Chile is the largest producer of copper and lithium. Argentina, along with Bolivia, has the largest reserves of lithium in the world.
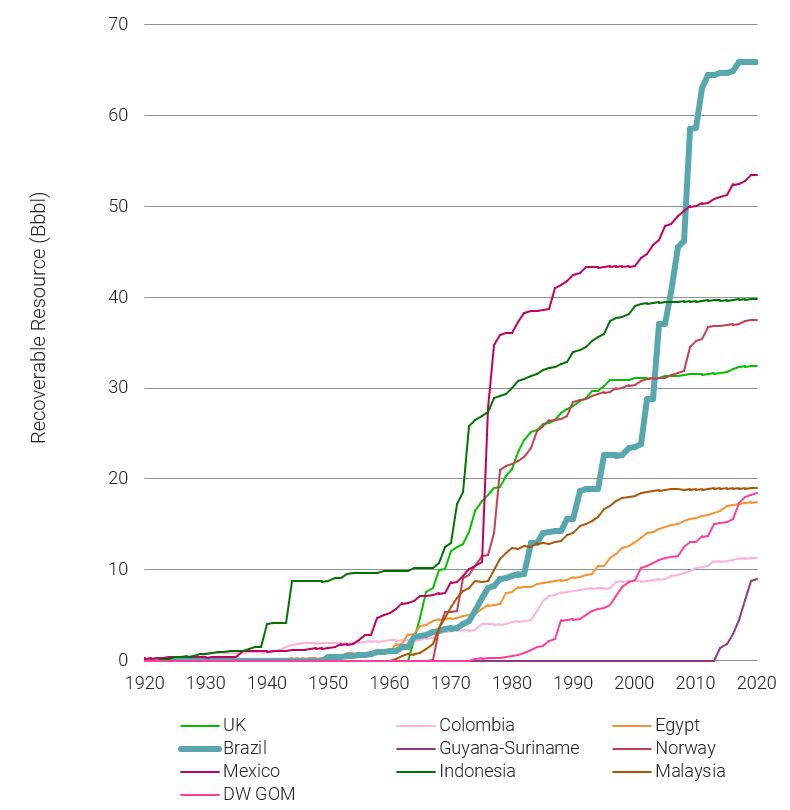
The continent is among the richest in oil reserves, with Venezuela holding the global leadership. In addition, Exxon has discovered significant new fields on the continental shelf of Guyana and Suriname in the last ten years. In Brazil, Petrobras is developing the largest pre-salt gas and oil reserves. The following graph shows the scale of the fields in Brazil (thick green line) and Suriname (dark purple line).
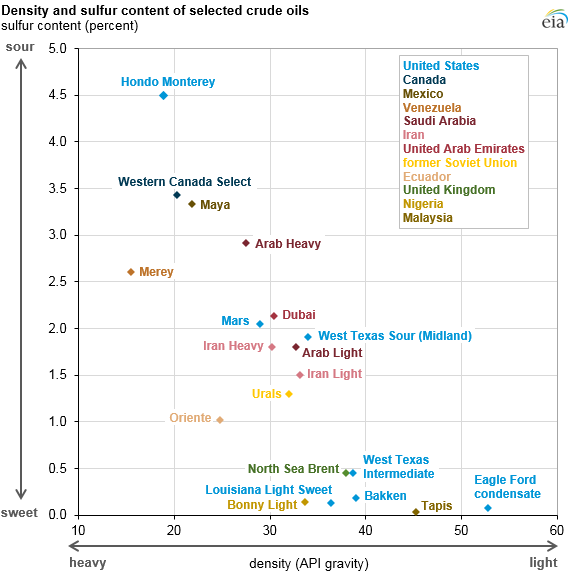
Pre-salt crude is significantly better than Venezuelan crude. The latter has a high sulfur content and relative density, and refining is a considerably longer and more complex process.
In the following chart, the main types of oil are presented according to the following two characteristics:
· Density (density/API gravity) is the difference between oil's density and water's. The higher the density, the higher the quality of the oil.
· Sulphur content - the less sulfur there is, the better the oil quality.
Venezuelan oil (Merey) is at the top left of the chart, while pre-salt fields are further downright.
Argentina is home to one of the most significant deposits of shale fossil fuels. Vaca Muerta is such a field. Here are a few parameters based on an analysis conducted by the IEA:
Extraction price - oil costs $40 per barrel, gas costs $2 per MMBtu. Prices are comparable to those in the US.
Reserves - 27 billion barrels of shale oil; 23 trillion cubic feet of shale gas. In both categories, it is in the top five in the world.
The field's geology is excellent - shallow deposits, high pressure, and many deposits are in a liquid state. All this makes extraction relatively easy, which means it is cheaper.
Gas production from Vaca Muerta has been rising regularly in recent years, reaching 269,000 barrels of oil per day and 76 million cubic feet of shale gas per day in October 2022. This is an increase of 42% for oil and 11% for gas compared to last year.
Fossil fuels are just an illustration of the region's natural resources. South American countries are among the largest producers of soybeans, sugar, coffee, orange juice, beef, precious metals, iron ore, copper, and lithium. The continent is more than self-sufficient in natural resources. At the same time, the world increasingly needs more resources.
Demographics
Natural resources do not matter if there is no large and well-educated population to develop and consume the resources. Latin America is among the continents with the most balanced demography between quantitative and qualitative parameters. Africa and India lead in absolute quantitative parameters, but they lag in qualitative ones, such as education, medical care, and the economic structure of society.
South America's demographic structure is not homogeneous, with countries such as Argentina and Chile already having declining birth rates. Still, they are at least 15 years away from the stage where Europe, Japan, and China are. Mexico and Brazil have the best demographic profiles reported in absolute terms.
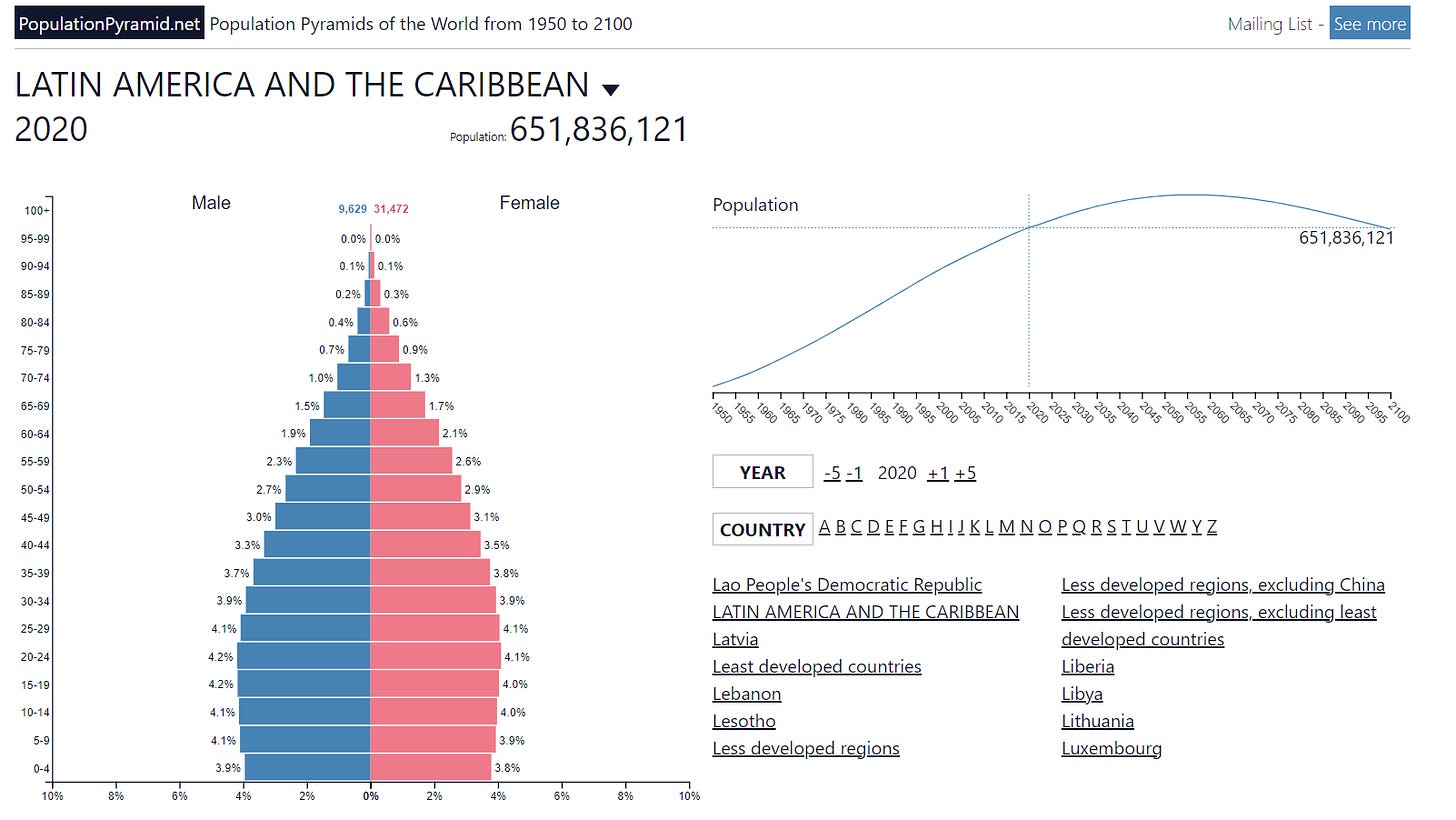
The following graph presents the demographic profile of Latin America and the Caribbean.
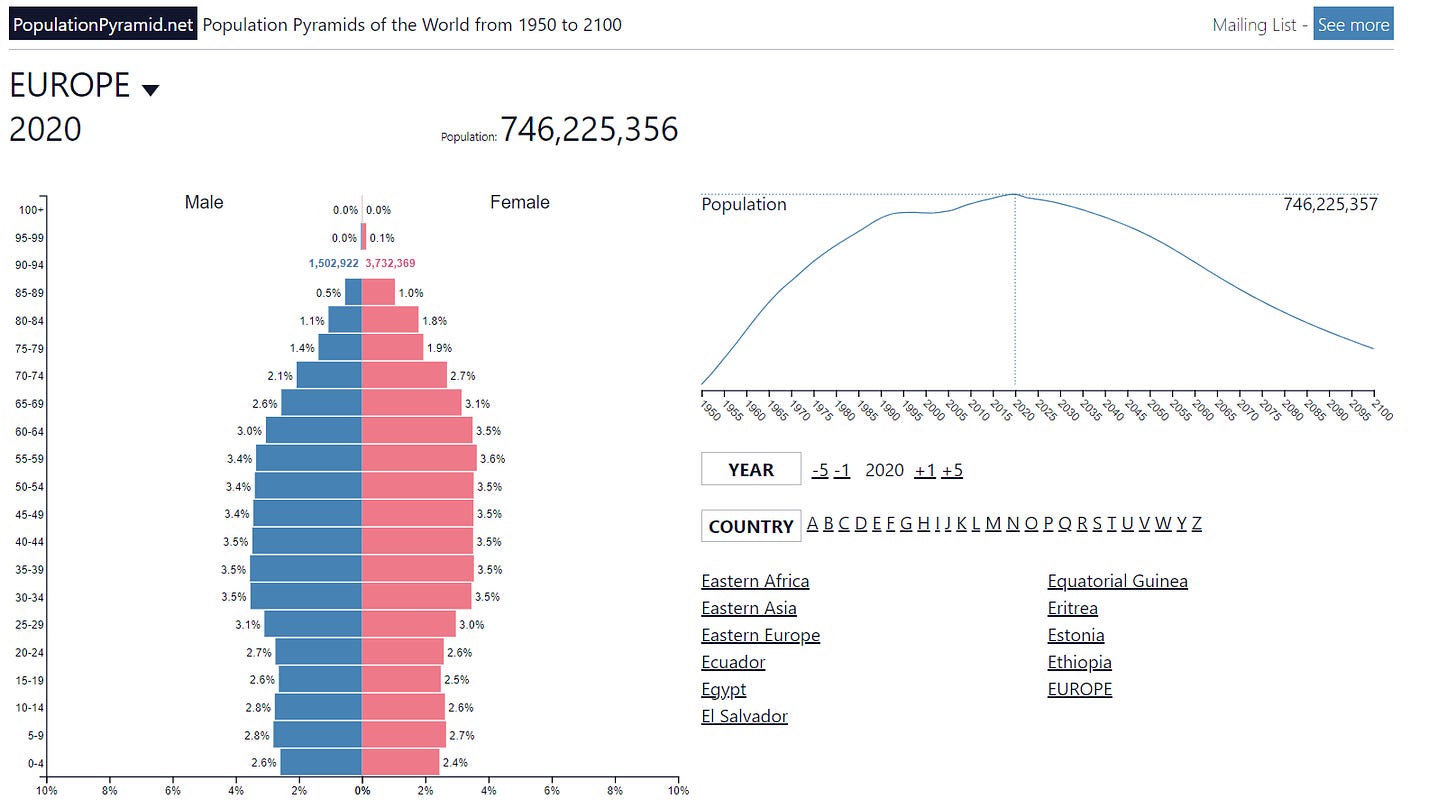
Yet the base of the pyramid is not as narrow (children and youth), and the middle (working-age population) significantly exceeds the top (retirees). The graph below shows Europe’s demographic structure.
Demography favors South America. Of course, the number of working-age people is a quantitative parameter that does not answer many questions, such as literacy rates, the number of teachers and doctors per 1,000 people, or equality rates. All three are not evenly distributed among South American countries. However, average levels for the region have been rising steadily.
Demography is destiny and determines the future of any country's economy. Demographic trends serve as a long-term indicator of which industries have the potential for growth, i.e., for investment. In the next section, I will introduce you to one of those industries.
LATAM banking industry
Banks and commodities are my passion, especially those in South America. I will end today's article with a brief overview of the banking sector in the region. Let's start with a chart. It shows the Price/Earnings ratio for multiple markets.
P/E is almost useless for analyzing individual businesses because it does not consider their specifics. I like the following maxim: net profit is an opinion, and cash flow is a fact. At the same time, the power of P/E lies in analyzing the stock market as a whole.
The chart above shows that all major economies in Latin America, except Mexico, are undervalued. Argentina, Brazil, and Chile hold a P/E around 7, while Colombia is the record holder at 5.1.
Latin America has urbanized rapidly in recent decades, leading to many problems but also to investment opportunities. Among them are banks. Still, a large part of the region's population does not have access to banking. However, unlike Africa, which lacks infrastructure and an efficient financial system, South America has both.
The first graph shows the proportion of the continent's population that is still unbanked.
Excluding Chile and Brazil, where less than 20% of their populations do not use banking services, the other major economies in the region have more people outside the banking system. This is a massive base of potential customers.
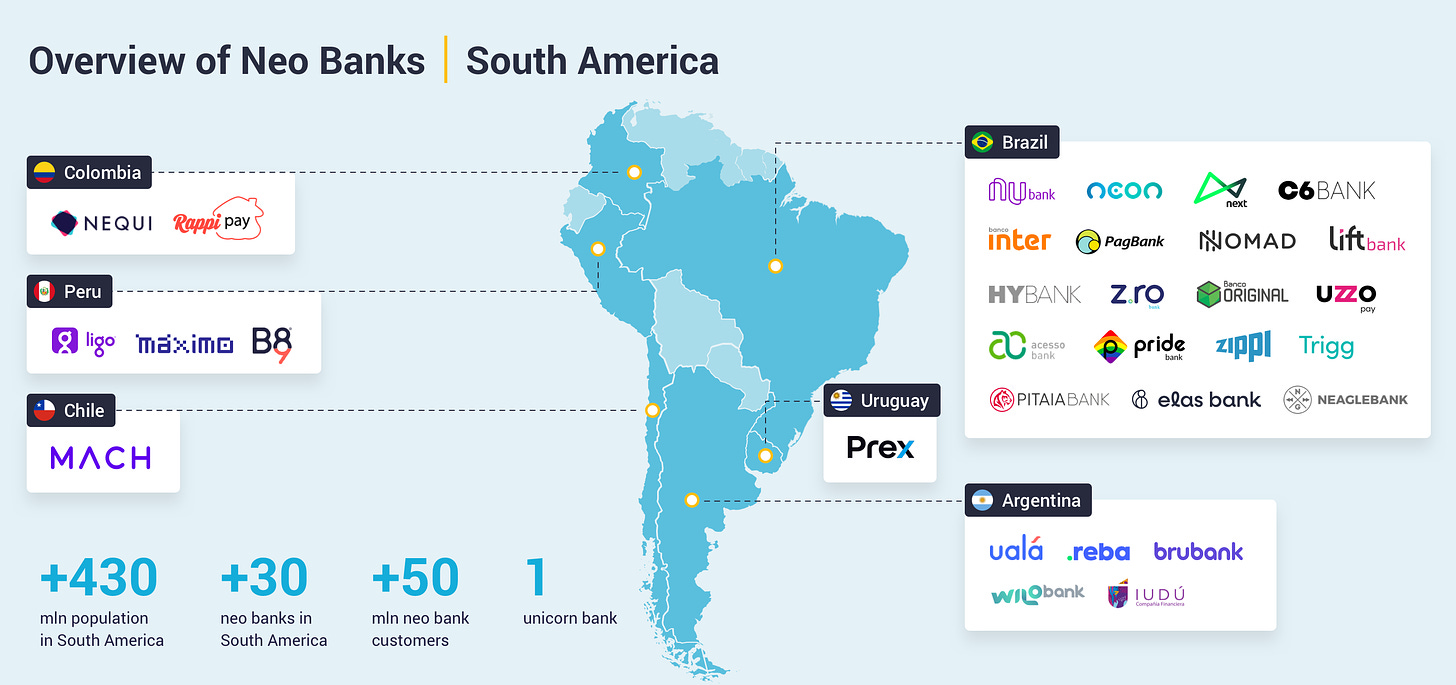
Chile and Brazil are among the leaders, but that does not exclude them from the equation. They have covered much of their population through traditional banking but are now transitioning to digital services. This is true for all countries in the region. Digital banking provides access in regions where infrastructure is lacking. To summarize, as an investor, I look for traditional banks that have successfully moved into digital services or fully digital banks (neo banks).
The following image is a map of neo-banks in the region.
Not all are public companies; a few are traded on the NYSE. There is only one exception - NU Bank. It is the largest neo-bank in the world, operating in Brazil, Mexico, and Colombia. Of the traditional banks in the region, the leaders are:
Grupo Galicia Argentina (GGAL)
Banco BBVA Argentina (BBA)
Banco De Chile (BCH)
Banco Santander Chile (BSAC)
Banco do Bazil (BDORY)
Banco Bradesco (BBD)
Banco Santander Brazil (BSBR)
All companies listed are traded on the NYSE through depositary receipts (ADRs), which are highly liquid and sold in US dollars.
Safety instructions or how NOT to invest in South America
Money always moves from the impatient and unprepared to the patient and prepared. Latin America demands more of both. Investing in regions and markets we do not know is dangerous.
The dominant part of South American economies and stock markets follow the commodity cycle. Their indices are, therefore, cyclical, following the price of the export commodities that dominate the local economy. Prices make sharp declines, followed by epic highs and new lows.
This feature is essential because by buying shares of even the Brazilian/Chilean/Argentinean bank, we are indirectly taking a long position in aluminum/copper/soy. Considering these features, buy and hold strategies, dollar cost averaging, and long-term positions for over a few years are not recommended.
South America is not the US or Europe, where you can hold stocks for decades, make capital gains, and receive regular dividends. Investing in South American companies requires a rigorous risk management plan that includes active position management.
A reminder: no matter how well-argued a hypothesis is, it is always incomplete. The missing facts can be decisive for the outcome of the scenario. Today's hypothesis is no exception.
It results from the author's research and analysis, making it limited, biased, and incomplete. Use the above as map markings. Following them is optional, as is using the map itself.
Anything described is for educational purposes only and does not constitute advice to buy or sell securities.






Your Substack is amazing! Glad I found It. You should do one for PaySubscriber with stock Calls .