Take the opportunity to peek behind the curtain of TheOldEconomy Pro Membership.
This is the Capesize Bulkers 2Q24 report for Pro Members published in October 2024.
A few shipping segments have the best fundamentals: low order book, aging fleet, and a lack of shipyard capacity. Dry bulk carriers are one of them.
Nevertheless, not all bulkers are equal. Capesize vessels are best positioned among them. They have a low single-digit order book and a progressively aging global fleet, and the next available slots for new buildings are after 2026.
In the meantime, the tonne-mile demand is poised to grow. The drivers are iron ore projects coming into production in the next 24 months and global demand for major bulks (iron ore, coal, and bauxite).
This is a 2Q24 review of the dry bulk carriers market. Today, I discuss the 2Q24 major bulk market, Capesize supply, and the Chinese economy.
Capesize market preview
The main variables that make me believe in Capesize's potential are intact. Let’s start with the big picture.
Global dry bulk trade during 2024 and 2025 is projected to grow by 2.6% and 0.7% in tons and by 4.4% and 0.5% in tonne miles, respectively. IMF projections support my thesis for GDP growth of 3.2% for 2024 and 3.3% for 2025.
Chinese GDP increased by 4.7% in Q2, missing initial expectations due to the struggling property market and a slowdown of household spending. China has taken monetary measures to crank up its economy. The last two days also brought news about future fiscal measures. More on that in the last chapter.
The Global South is the prime consumer of major bulks. India, China, and the Middle East lead. Their combined imports increased by 4.3% YoY. Western economies' imports rebounded after two years of contraction, yet they had lower rates than the Global South.
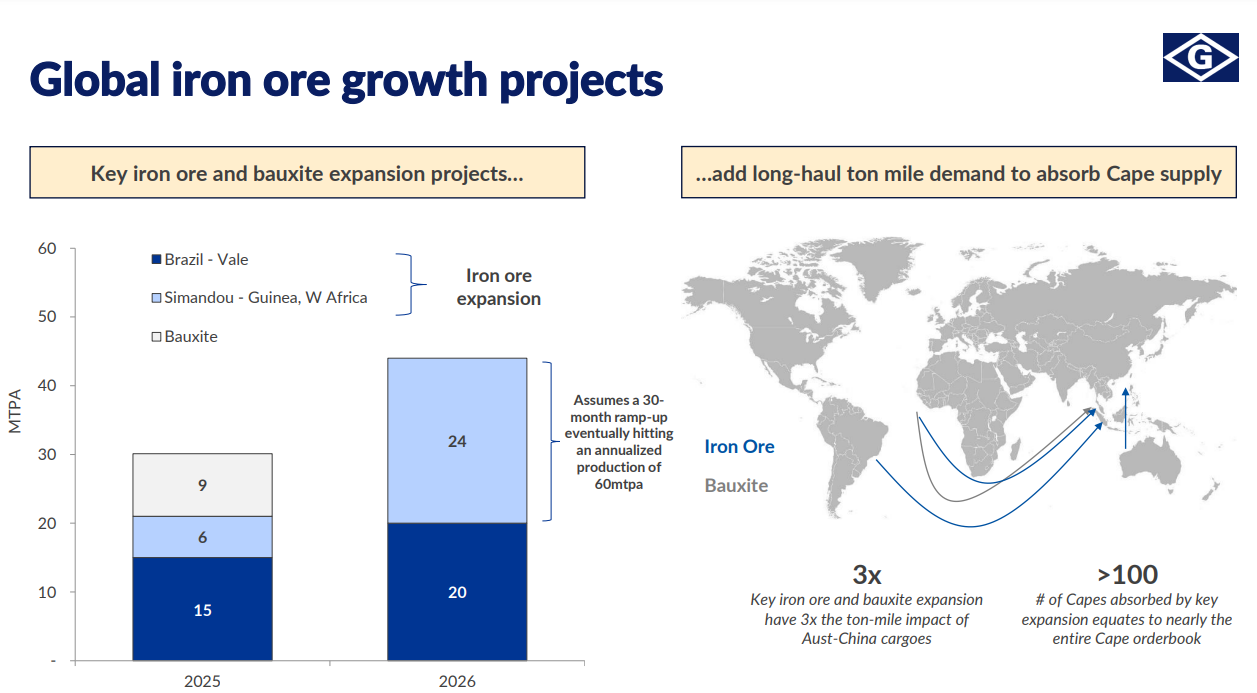
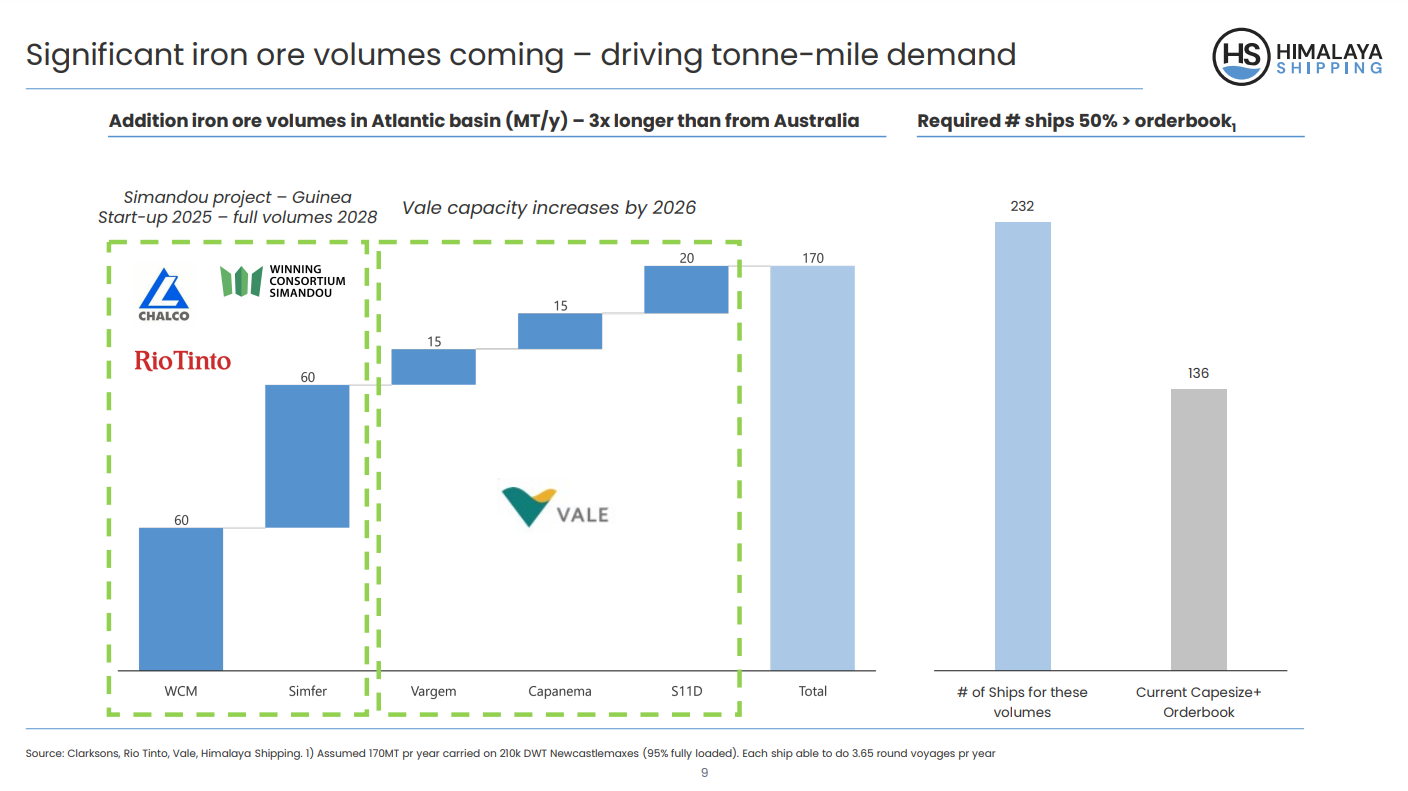
Iron ore demand is projected to expand by 3.1% in tons and 5.6% in tonne-miles in 2024. Again, China is a top consumer, and Brazil is a leading producer. For example, the Brazilian company Vale scheduled three projects in 2025-2026: Capanema, Vargem, and SD11. The composite output increase will be up to 340-360 million tons, compared to the present annual output of 310-320 million tons. The following chart tells it all.
The number of incoming iron ore projects will further push the existing Capes shortage.
Coal market dynamics have a lower impact on Capesize tonne-mile demand. Nevertheless, in a market dominated by a deficit, a tiny growth in coal exports can exacerbate the already existing shortage. Coal trade is expected to expand by 0.6% in 2024 but contract by 0.5% in tonne-mile. Chinese imports increased further in 1H24, supported by a 1.9% YoY decline in domestic coal production and a 2.2% YoY increase in thermal electricity generation. During 1H24, India emerged as a leading buyer of coal. Domestic consumption outpaced production growth, and inland infrastructure constraints led to a strong increase in import requirements.
The supply side remains constrained, i.e., the number of available vessels. The triad on the deficit is here: low order book, aging fleet, and lack of shipyard capacity. Additionally, two more factors amplify and further the deficit.
Environmental regulations limiting SOx (sulfur oxides) and NOx (nitrogen oxides) are punishing the older ships and those without scrubbers. To comply with regulations, those vessels have to maintain lower speeds. The lower the speed, the longer the voyage and the contract; thus, fewer ships are available for new employment. Port congestion is another variable to consider. Nevertheless, in recent months, the congestion has declined.
In summary:
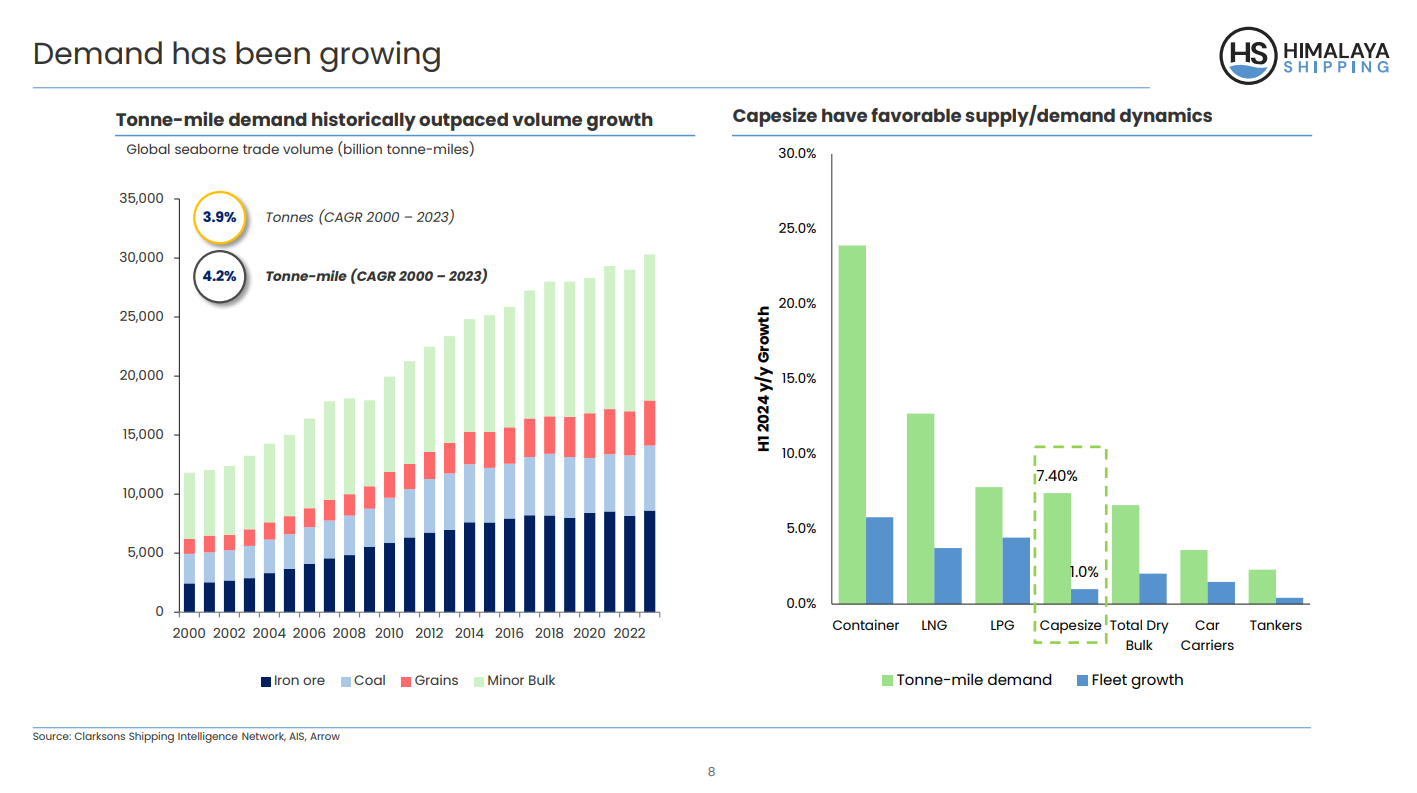
Tonne-mile demand vs fleet growth is exceptionally lucrative for Capes.
Let's look at each side of the equation in detail: the Capesize vessels market and the major bulk market.
Capesize market
The shipping industry is simple. Three variables define the long-term supply: order book, age profile, and shipyard availability. These are enough to create a credible forecast of future vessel supply.
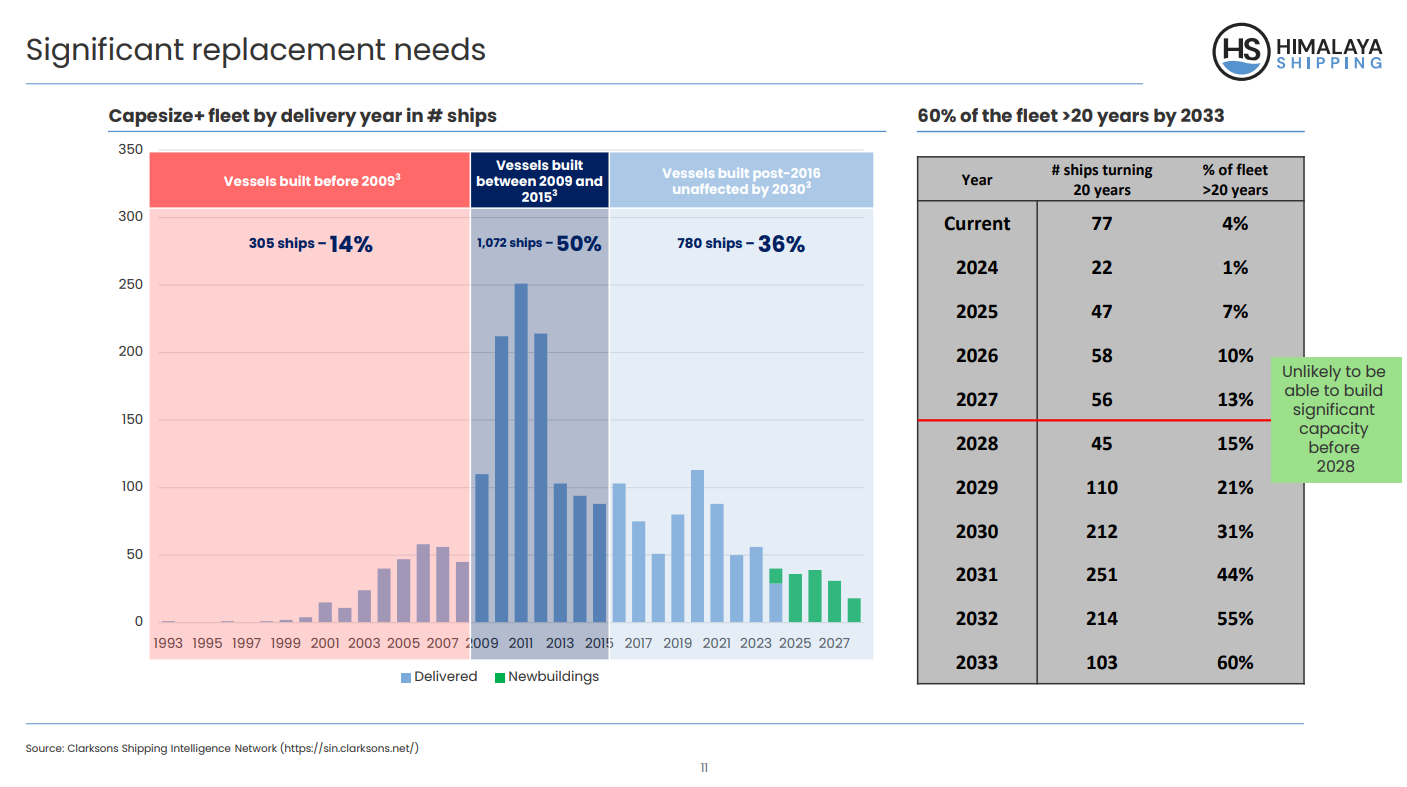
Dry bulk carriers are attractive, but the Capes are the most interesting. The order book is way lower than the number of ships approaching 20 years. So, ship owners must meet the excess demand for major bulk transportation and replace aging and inefficient ships.
Building costs are going up because of structural inflation. The equation is straightforward: higher inflation leads to higher capital, labor, and materials costs. In addition, we must consider environmental regulations. They impose strict requirements that are difficult to meet for aging ships. The new vessels have dual fuel propulsion and scrubbers, making them more competitive. This results in higher TCE rates and lower daily operating expenses.
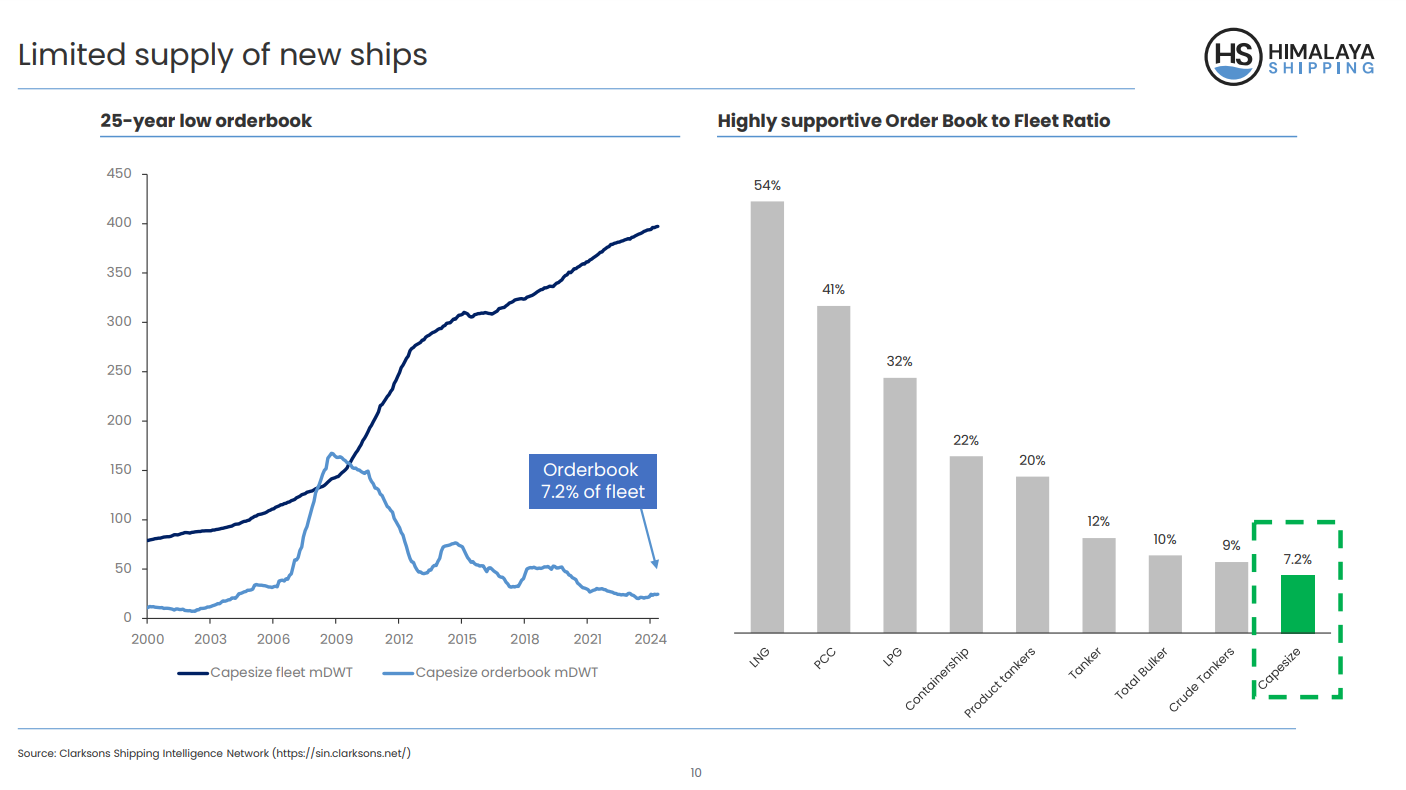
Capesize order book has increased slightly compared to 1Q24, up to 7.2%. The chart below (via Himalaya Shipping) shows Capes's order book compared to other ships.
In my opinion, the most significant bottleneck in shipping is the decreased shipyard capacity, which has dropped by 64% since 2008. The next available slots for new Capes are beyond 2026. Until then, the yards are busy with LNG/LPG carriers, containers, and car carriers.
The age of the global fleet is consistently rising. Ship age is not just a number. The older the ship, the higher the operating expenses and the lower the vessel utilization.
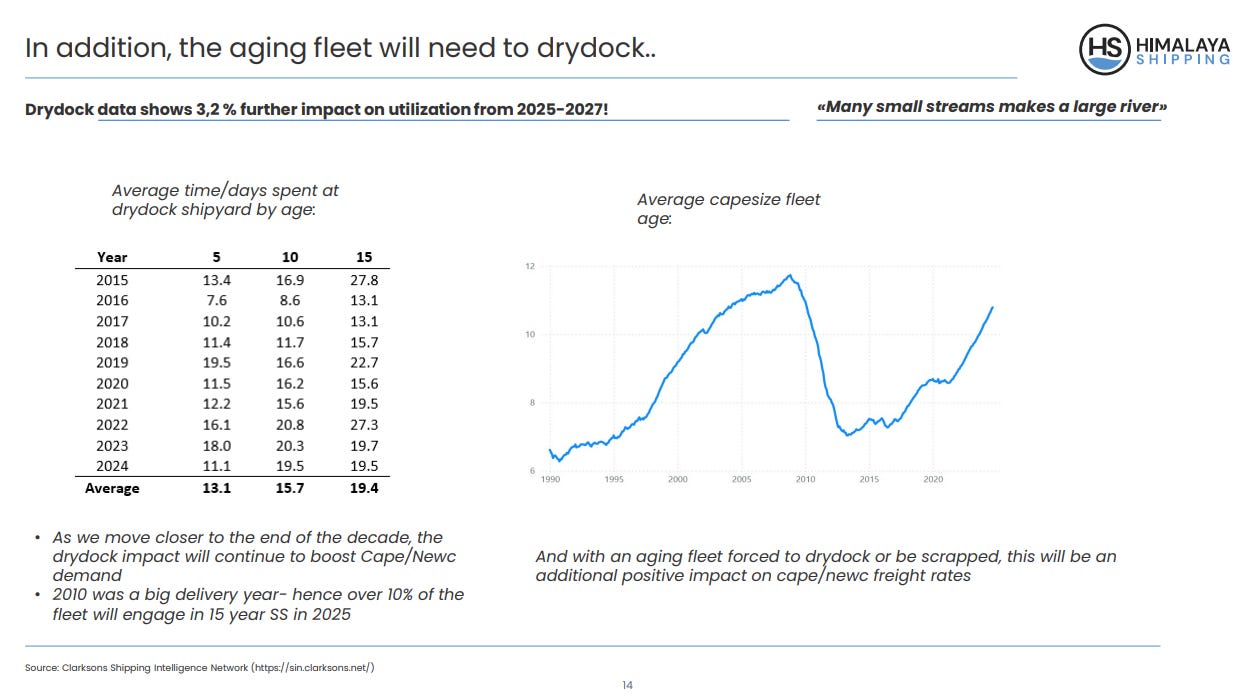
The latter is due to more frequent scheduled maintenance and unexpected breakdowns. In addition, dry bulk vessels, like all cargo ships, have a 15-year Special Survey. In simple terms, this is a detailed inspection of the vessel's integrity in all aspects. The duration is measured in weeks. So, the older the global fleet, the more ships are due for 15-year surveys, resulting in an even tighter supply.
The left section of the chart provides more details on the survey's length, which is 20 days in best-case scenarios.
2010 marks the peak in the previous dry bulk shipping cycle, driven by Chinese economic expansion. A large percentage of the present fleet was delivered in the 2009-2011 period. According to estimates, 10% of the present fleet is due to a 15-year survey.
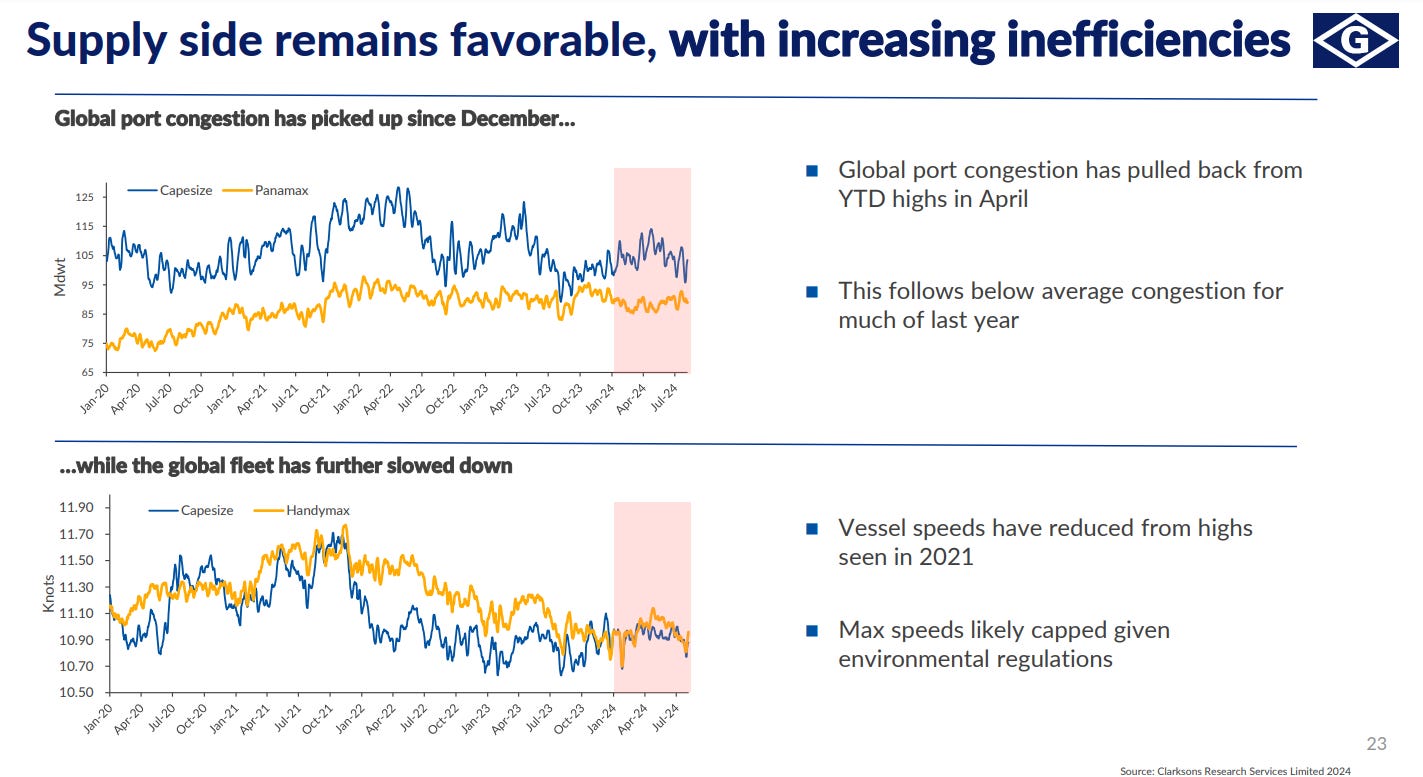
Let’s say a few words about Capes speed. The average speed of the dry bulk fleet has stabilized at lower levels between 11.1 and 11.2 knots in 1H24. The main reason is the air emission restrictions. As pointed out, older ships can not easily meet the requirements, so they must reduce their speed. The chart below (via Genco Shipping) shows the port congestion and average vessel speed.
Port congestion, one of the constraints for Capes (and all bulk carriers), has fully normalized all dry bulker sizes.
In summary, the stars are aligned for a constrained supply of Capesize vessels. Now, let’s look at the demand forces.
The demand side: Major Bulks geography
Demand for iron ore and metallurgical coal is a function of global steel consumption. Japan, India, and China are the largest steel consumers. Australia, Brazil, South Africa, Canada, and India are the primary iron ore exporters. Thus, two plus one (South Africa is in the middle) of the five major exporting countries are in the Western Hemisphere. At the same time, the demand is concentrated in the Eastern Hemisphere.
Metallurgical coal production is more concentrated in the East. Australia, Indonesia, and Russia are the top three, followed by the US and South Africa. Colombia is a newcomer and is gaining traction. Colombian exports to Asia have been on the rise since the beginning of 2024.
The third major bulk is bauxite. Again, the supply is scattered between East and West. The top five producers are Australia, Guinea, Brazil, China, and Indonesia.
In the coming years, more iron ore and bauxite projects will be developed in the West, while consumption will grow faster in the East. The geographical dislocation between supply and demand is the best friend of shipowners. It simply means not only tonne-mile demand but robust growth in demand.
Let’s start with the steel production.
Steel
Global steel production increased by 3.0% in 2Q24 compared with 1Q24, driven by a 5.5% increase in production in China, the world’s largest steel producer. Indian steel production declined by 2.8% in 2Q24 compared with 1Q24. Outside of China and India, steel production increased by 0.6% compared with the prior quarter and is expected to increase further over the next several years as construction activity recovers from current depressed levels.
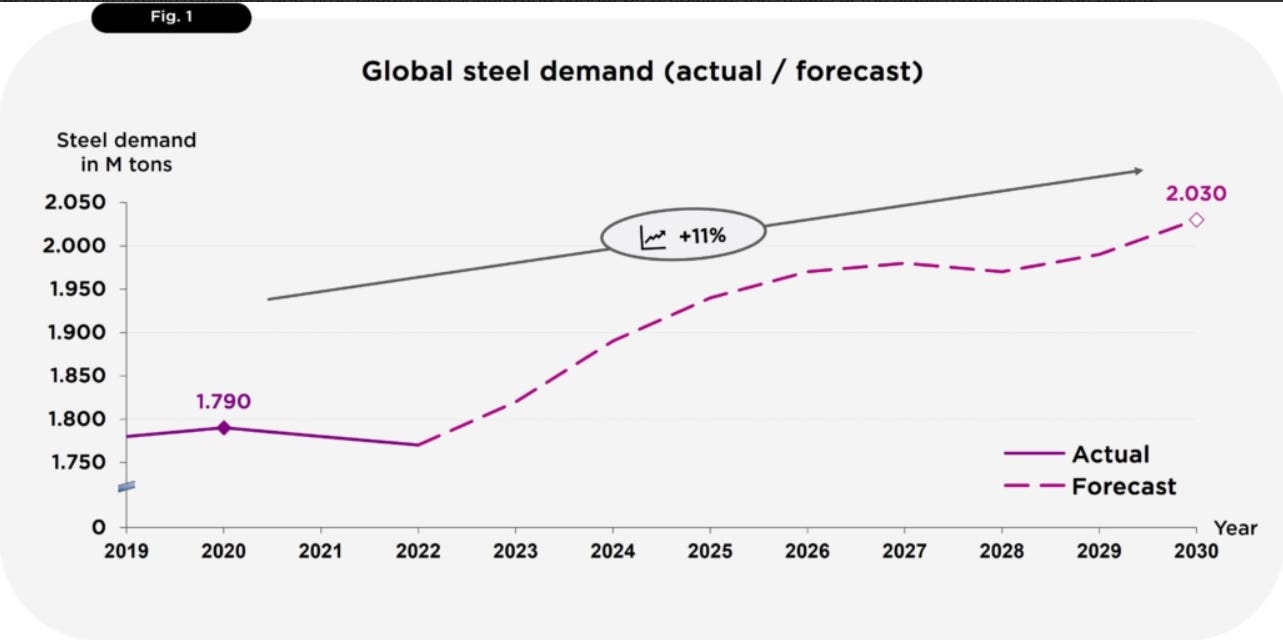
The long-term trend in steel demand is still intact. Chart via Bronk & Company.
The demand is projected to grow by 11% by 2030, which means that iron and metallurgical coal will be needed in vast quantities.
Iron ore
Nearly 70% of global iron ore is transported via Capes. As pointed out earlier, the iron ore supply is projected to grow faster in the West. The chart below from Himalaya Shipping shows the pipeline with iron ore mines planned to go into production in the next 24 months.
Rio Tinto and Vale projects will add 170 Mt/y combined. In 2023, the global iron ore supply was 2.5 billion tons. The new projects will add 6.8% to the total. 232 Capesize ships are required to carry that amount of ore, compared to the present order book of 136 vessels. I think this chart tells us everything we need to know about Capesize's thesis.
China's iron ore imports rose 7% through July YoY, led by solid export volumes in the seaborne market, most notably from Brazil. A portion of China's higher imports has replenished previously drawn-down inventories. With the PBOC's monetary measures and the expected fiscal splurge from the Chinese Treasury, iron ore consumption is expected to rise in the coming quarters.
Bauxite
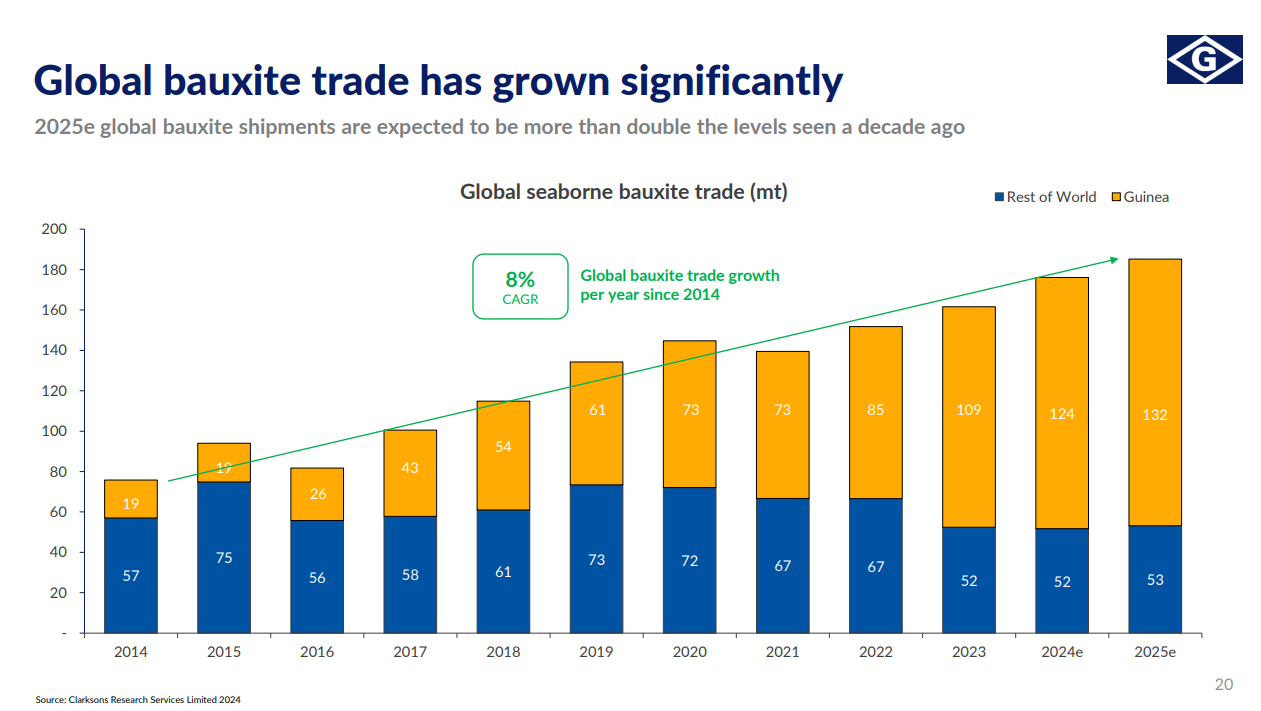
Bauxite is the feedstock for aluminum production, and about 60% of world bauxite is carried by Capesize ships. Seaborne bauxite trade is projected to grow in the next 12 months. The chart below shows that Guinea has become a leading exporter in recent years.
Guinea's exports reached 38.01 million tons in 2Q24. YoY, Chinese bauxite imports from Guinea increased by 18%. The period between July and September is a rainy season. It is expected to reduce loading efficiency, but the impact will be insignificant and short-lived.
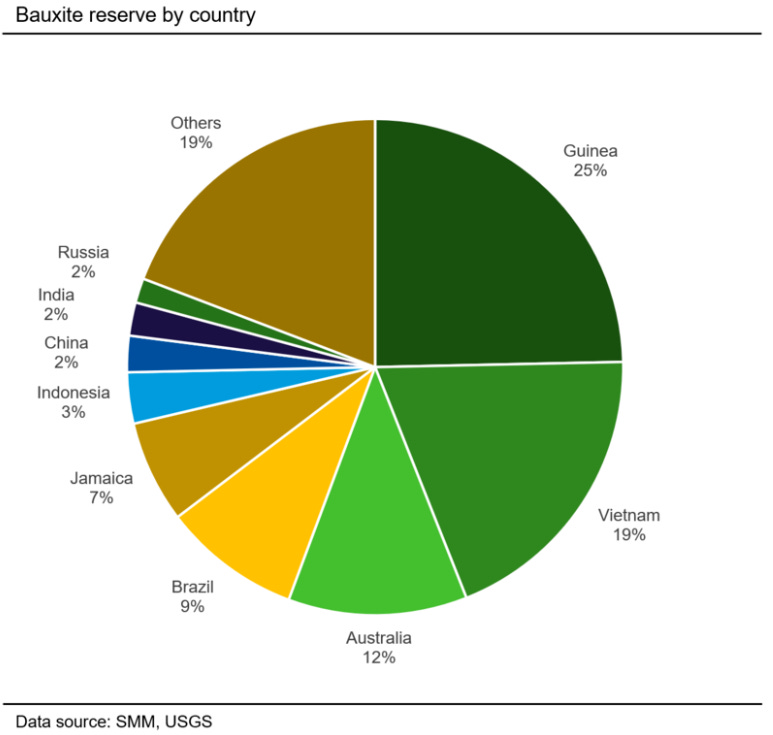
Guinea has long-term potential because it holds the largest bauxite reserves. Chart via SMM.
The country has become a commodities powerhouse with vast iron ore and bauxite reserves. This is excellent news for Capesize ships, as it means robust tonne-mile demand for longer.
Coal
Coal market dynamics impact the Capes market but to a lesser degree than iron ore and bauxite. 28% of all seaborne coal is carried on Capesize vessels, but coal represents only 21% of the total demand for Capesize vessels. That said, the coal trade is more dependent on the Capesize segment than vice versa.
Recent trends, particularly for Colombian coal exports, have shifted towards using Capesize vessels for longer routes to Asia, replacing shorter European routes. For example, in the first five months of 2024, East Asia accounted for 54% of Colombia's total Capesize coal exports.
In the first six months of 2024, Chinese coal imports grew by 12% despite healthy stocks. This is notable considering that imports in 2023 were already 140 Mt higher than the previous record.
In summary, 2Q24 saw growth across all major bulks. Moreover, the projections are favorable for ship owners and investors. The world needs more iron ore, bauxite, and coal, and someone has to transport it.
Reports review
In this chapter, I review 2Q24 results for major Capsize owners.
I excluded companies like Navios Maritime, Tsakos Energy Navigation, and SFL Corporation from the list. These shipping conglomerates operate in multiple segments, and Capesize ships deliver below 30% of total revenue.
Navios has the largest Capesize fleet in the list above, comprising 35 vessels. This number is comparable to Golden Ocean and StarkBulk, which own 52 and 34 Capes, respectively. Nevertheless, dry bulk shipping still represents a fraction of Navios’ revenue.
Let’s start with Genco Shipping.
Genco Shipping
GNK has entered into agreements to sell Genco Warrior and Genco Hadrian. The former are 2005-built Supramax ships, while the latter are 2008-built Capesize. Warrior is sold for $11.95 million and Hadrian for $25 million. Those figures are competitive considering the present prices. The chart below (via Compass Maritime weekly) shows dry bulk vessel values.
Hadrian is a smaller size Cape with 169,000 dwt. The newer trends are for smaller (about 156,000 dwt) or larger (about 175,000 dwt) ships. Moreover, Hadrian's age means its propulsion is inefficient, so it can not comply with strict environmental regulations. The only way to do this is to reduce speed. However, this is a short-term beneficial decision with long-term adverse effects.
Genco is the segment champion when it comes to the balance sheet. Since 2020, the company has extinguished almost 80% of its debt, resulting in a loan-to-value below 10%. In 1H24, Genco paid down $100 million of its revolving credit facility as part of its goal to debt zero.
Golden Ocean Group Limited
Golden Ocean is the second-largest shipowner in the peer group. The Company's fleet comprises 84 owned vessels (52 Capesize and 32 Kamsarmax/Panamax vessels).
In 2Q24, GOGL agreed to sell one Panamax for a net consideration of $20.8 million, bringing the company's net gains to $4.3 million. Six drydocks (five for Capesize vessels and one for Panamax vessels) are expected to be completed in 3Q24.
In April, GOGL entirely drew down $180 million of its credit facility to finance six Newcastlemax ships. The facility comes with SOFR + 1.6% interest and a 5 bps sustainability component based on emission reduction performance.
Himalaya Shipping
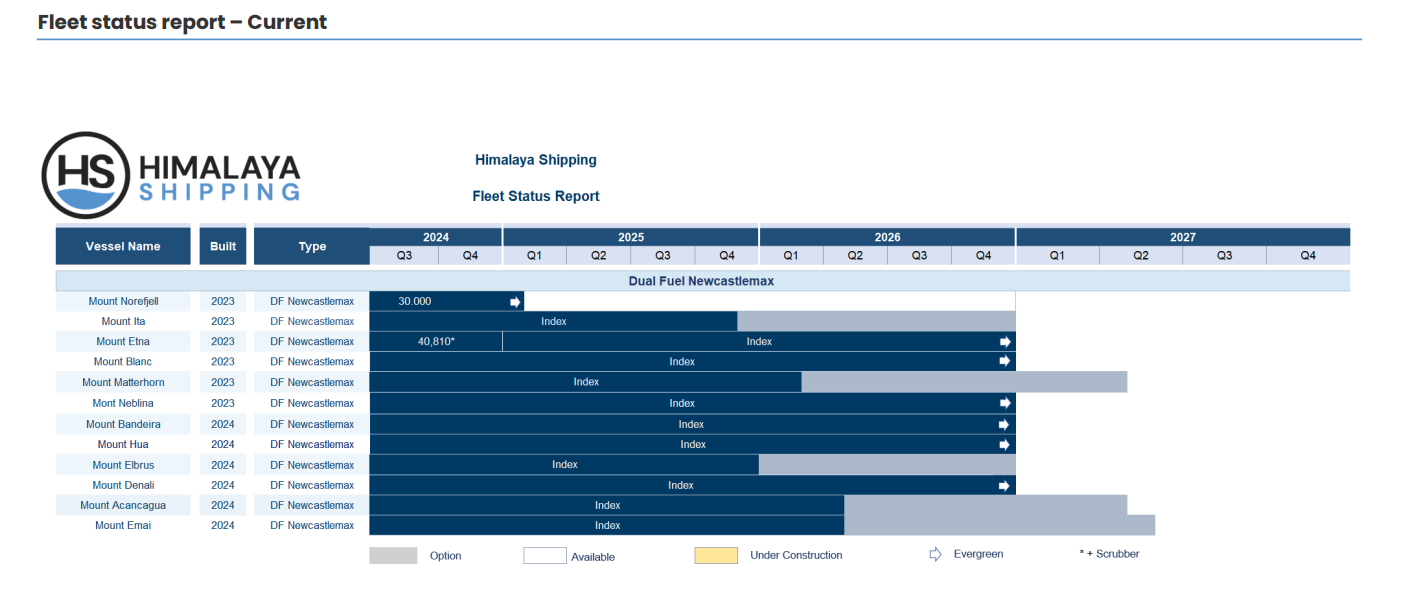
Himalaya Shipping owns the best fleet in the group: 12 brand-new Newcastlemax ships with dual-fuel engines and scrubbers. In 2Q24, the company delivered its last three vessels, Mount Denali, Mount Aconcagua, and Mount Emai. The ships are employed under index-linked charters.
Two ships, Mount Neblina and Mount Blanc, fixed charters from index-linked charters from May 1, 2024, to June 30, 2024, at $36,750 and $37,800 per day, respectively.
A top-notch fleet comes at a steep price. HSHP has the most leveraged balance sheet. As of June 30, 2024, we had principal debt outstanding of $740.8 million, of which $12.9 million and $13.2 million are payable in the remaining six months of 2024 and the first half of 2025, respectively.
During 1H24, HSHP drew $196.9 million in financing to pay a scheduled delivery installment on Mount Elbrus, Mount Denali, Mount Aconcagua, and Mount Emai.
Star Bulk Carriers Group
SBLK is the largest dry bulk operator globally. The company has 34 Capesize ships in its +100 ships fleet. Star Bulk offers exposure to all dry bulk segments from Supramax to Newcastlemax.
In 2Q24, SBLK completed the transaction with Eagle Bulk. Below is a quote from the 2Q24 report about the synergies of the merger:
• Cash received following the Eagle Merger amounted to $104.3 million • Eagle Bulk’s Convertible Notes matured on August 1, 2024, and converted to 5,971,284 shares of Star Bulk common stock
• 1,341,584 shares of Star Bulk have been loaned out as part of a share lending agreement with Jefferies Capital Services and have been returned and canceled
• The fully diluted share count is 118,825,307
Crewing management is gradually being taken in-house, with the expected cost reduction of $600/vessel/day to be realized by Q2 2025
• Dry docks of 12 ex-Eagle Bulk vessels have benefited from Star Bulk's competitive pricing agreements with service providers and shipyards globally
In 1H24, SBLK sold ten vessels for $180 million in gross proceeds. The average age of the vessels sold is 15.1 years. The company announced contracts with Qingdao Shipyard to construct 82k dwt Kamsarmax new building vessels.
Seanergy Maritime Holdings
SHIP is the other Capesize-only company in the group. Unlike HSHP, its fleet is old. In 2Q24, the company announced a new time charter with Costamare Inc. for MV Lordship.
The day rate is based on the 5 T/C (weighted average of five of the most critical routes) of the BCI (Baltic Capesize Index). Based on the prevailing Capesize FFA curve, the company can convert the daily hire from index-linked to fixed for a minimum period of 2 months to a maximum of 12 months.
SHIP entered into a $58.3 million leaseback agreement to refinance MV Hellasship and MV Patriotship. The vessels have been sold and chartered back on a bareboat basis for five years on each delivery date. The lease agreement interest is a 3-month term SOFR plus 2.55% per annum.
2Q24 wasn’t eventful for dry bulk shipowners. In the coming months, however, I expect more volatility. The reasons are well known: China is a prime consumer of major bulks and the incoming large iron ore projects. That said, let’s move to the next section.
In the following chapter, I will discuss companies' finances and valuations.
Choose your player
Unlike LPG and LNG, where the number of publicly traded companies is a handful, the dry bulk segment offers a large menu of options. Nevertheless, Capesize plays are a few. So, our contenders are:
Genco Shipping & Trading Limited, GNK
Himalaya Shipping, HSHP
Seaenergy Maritime Holdings, SHIP
Golden Ocean Group Limited, GOGL
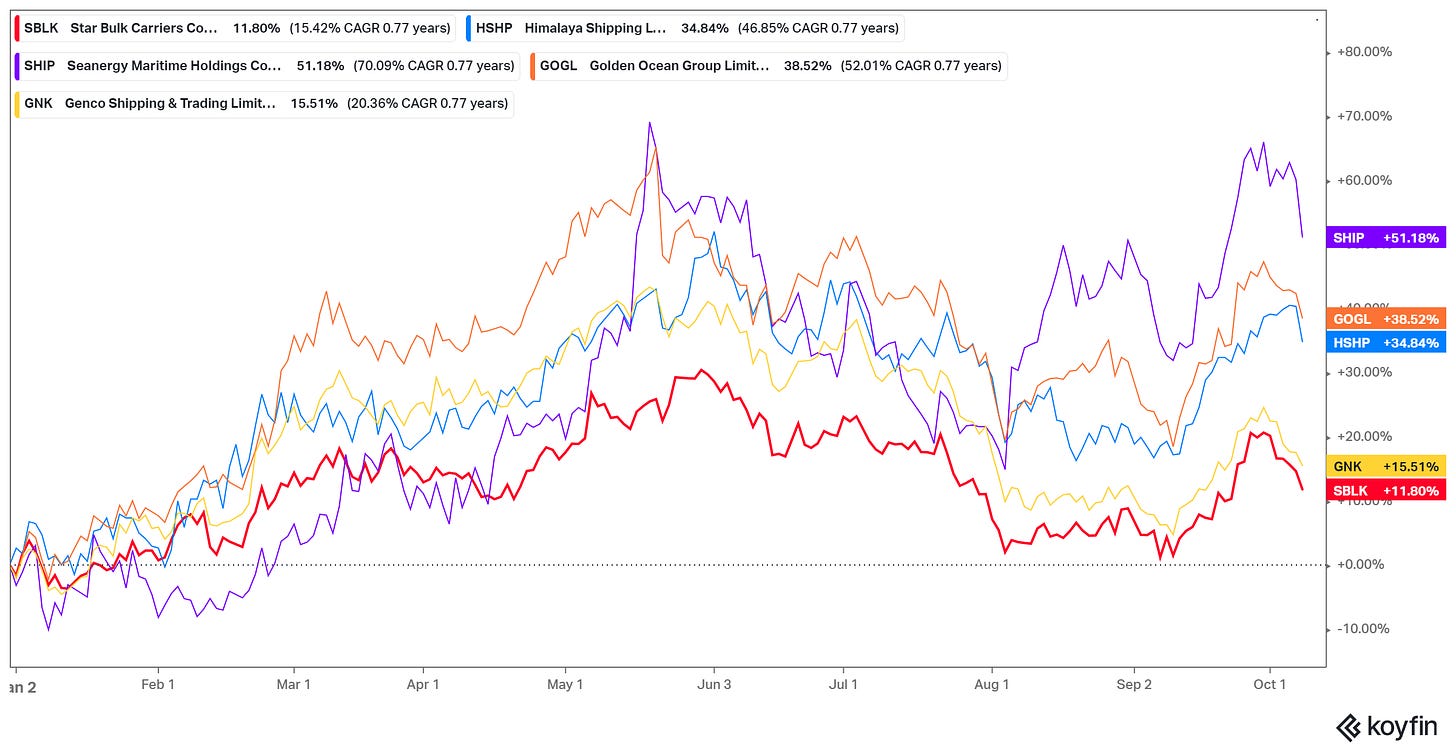
1H24 was successful for the dry bulk segment. The chart below compares the YTD performance of our contenders.
SHIP and GOGL lead the pack, while SBLK and GNK lag. In the long term, I expect all of them to deliver Alpha. However, the point is to pick the best ones. With that idea in mind, let’s move to the Valuation table.
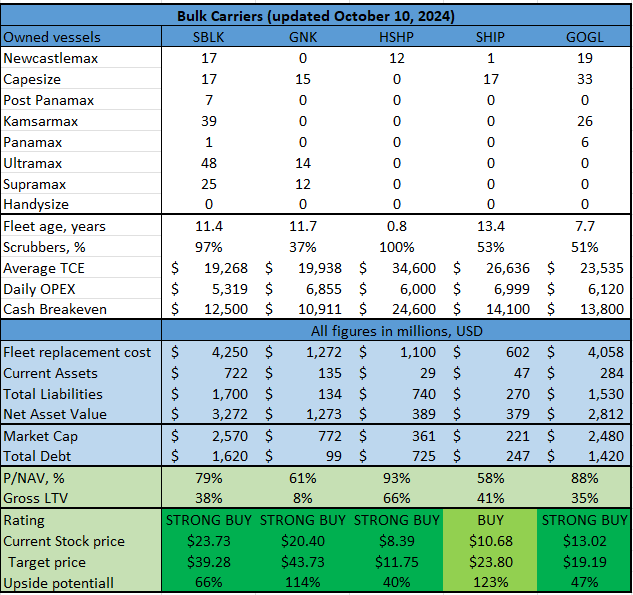
Note: during the shipping cycle peak, stocks trade at 130%- 150% PNAV. Hence, to obtain the “Target Price,” I multiply the NAV/share value by 1.3.
The top section shows the fleet specs, types of vessels, and average fleet age. The middle section shows the company’s operating figures: TCE, daily OPEX, and breakeven free cash flow. The following lines are dedicated to NAV and LTV formula inputs. The bottom part gives the company’s PNAV and Gross LTV.
If we consider their operating figures, Genco and Himalaya are on both sides of the scale. Genco scores the lowest LTV, which leads to the best breakeven cash flow. If we divide TCE by breakeven, we get 57%. This means GNK has a 43% margin of safety. Simply, the company can survive a 43% decline in TCE without negatively affecting its liquidity and solvency.
Of course, there is no free lunch. Single-digit LTV usually comes with an old fleet. The GNK fleet is 11.7 years old, while HSHP is less than one year old. The dilemma for shipping investors is to pick between:
Newer fleet with lower operating expenses and higher breakeven cash flow
Older fleet with higher operating expenses and lower breakeven cash flow.
Himalaya is in the former category, and Genco is in the latter. There is no better or worse choice here. The point is to be aware that there is always a trade-off.
The market values HSHP generously, but I think it is justified. The timing of its new fleet is perfect. Now, the company can ride the shipping cycle. Moreover, its new ships with scrubbers have a significant advantage. Himalaya’ TCE is proof of that. It is 30% higher than SHIP’s, the second Capesize-only company on the list.
SHIP owns the oldest fleet. This brings significant operation risk. Plus, the company has a high LTV. Remember the shipping triad. We cannot get all three: top-spec fleet, low LTV, and low PNAV. There is always a trade-off. In SHIP’s case, we have a high LTV and an old fleet. Considering that the company is supposed to trade at a 50% discount to its NAV. However, the case differs; SHIP trades at a 35% discount. Not the best combination.
Golden Ocean’s fleet structure is similar to Genco's. The company owns 52 Cape and 26 smaller ships. Its fleet has a lower average age, and a higher percentage of the ships have scrubbers.
SBLK is a more generalist choice, which is not bad per se. Investing in SBLK exposes us to the broader dry bulk segment, and the company pays attractive dividends.
So, let’s look at the finances. The following table illustrates the company’s balance sheet, profitability, and shareholders' return.
GNK and HSHP are again on opposite sides of the scale. The former has 66% Total Debt/Equity, while the latter has 461%. The other contenders’ balance sheets are in the middle. When discussing liquidity, measured with EBITDA/Interest Expenses, only HSHP lags, unsurprisingly. New ships come at a dear price.
From an investor's standpoint, SBLK offers the best shareholder return policy. The company distributes attractive dividends and has a buyback program. I like buybacks because they reduce the number of pizza slices. Also, all things being equal (dividend distributions), the lower the share count, the higher the dividend yield.
I want to see more share repurchases in the coming quarters, as GNK and SHIP are good candidates. Their shares trade at an adequate discount to their NAV.
In the previous quarter, I gave a Strong buy only to GOGL and HSHP and a Buy to SBLK. In recent months, the share prices of dry bulkers have made a nice pullback, which led to more tractive valuations. Considering solid fundamentals, all dry bulk stocks are a Buy.
Risks
My Capesize idea depends heavily on the Chinese economy. The logic behind it is simple. Stronger China consumes more of everything and vice versa. The first decade of that century is proof of that.
I am not expecting a repetition of that growth because acute Chinese problems are approaching the surface. However, I believe in CCP's ability to kick the can down the road for the next few years. That said, it's time to talk risk.
China is the prime risk, but it is not the only one. I divided them into two categories: systematic and idiosyncratic.
Systematic risks:
Global recession
Weak Chinese economy
Idiosyncratic risks:
Financial risk
Operational risk
Global Recession
On the global recession scene, we have not had any significant changes since my report on LPG shipping. Below is my take on the recession from the LPG market 2Q24 report:
The odds of economic contraction in the next 12 months have increased. As discussed in my article “Thoughts on inflation, interest rates, and antifragile ideas,” I expect cyclical inflation to return due to the dovish FED stance. Of course, this will not happen overnight. It takes time for monetary shifts to be reflected in the real economy.
Rising inflation does not imply recession when considered in isolation. However, during inflationary times, we can experience economic problems. The labor market sent mixed signals over the last two months, while economic growth exceeded expectations.
Digging deeper into the macroeconomic metrics, the picture is not yet recessionary. The number of commercial flights and heavy vehicle sales are far from the recession zone. The banks are still happy to land money. The chart below shows the net percentage of banks tightening lending standards. Those two indicators do not portend eternal prosperity. What they do is give a balanced view.
When discussing economic forecasts, we must remember that four things matter: rate of change, direction of change, relative values, and time lag. Never take absolute values in isolation, and never discard the role of time.
Last week brought strong labor market figures. Elections are coming, and the economy must look immaculate. In that matter, China and the US are more similar than different. The numbers are more important than the reality.
Today, the CPI is coming out. I am not expecting significant changes, especially if they go in the wrong direction. It is too late for inflation resurrection. The present US administration will do its best to mimic a strong economy.
Dock worker strikes had the potential to unleash cyclical inflation. However, the strike ended prematurely. Now, the Iran-Israel war is the big unknown. As discussed in my last weekly review, the probability of a massive-scale attack on Iranian oil facilities is relatively low, and so is the blockade of Hormuz. I anticipate Israel attacking tier-3 infrastructure just to project its capabilities.
In summary, the recession is postponed, at least for now.
Weak Chinese economy
The Chinese economy is the most crucial variable in major bulk demand and, thus, in the tonne-mile demand growth rate.
The latest liquidity injection from the PBOC sent Chinese stocks and commodities upwards. This week, however, the news cooled down enthusiasm because of the expected not-so-extravagant fiscal measures. Investors' response illustrates the principle that when good news is not good enough, it becomes bad news.
Saturday, October 12, a press conference is scheduled. More details below:
BEIJING – China will hold a briefing on fiscal policy on Oct 12 as investors look for additional measures to stimulate the world’s No. 2 economy.
The State Council Information Office announced the event on Oct 9. Finance Minister Lan Fo’an will introduce moves to strengthen fiscal policy to shore up growth and answer questions from reporters, according to the notice.
“Markets continue to swing between disappointment and hope for fresh, meaningful fiscal stimulus that would have a greater impact on business sentiment and employment,” said senior currency strategist Fiona Lim at Malayan Banking.
“That said, the sense of urgency at the top is clear, and recent monetary easing and housing measures have also been sizeable. As such, it is worthwhile to be cautiously optimistic at this stage.”
In my opinion, the Chinese government will press the pedal to the metal. The CCP desperately needs to boost the economy and will do what it takes. That is good news for dry bulk shipowners.
Adding geopolitics to the mix makes CCP motives more obvious. China stocks incredible amounts of commodities. This is a backup plan in case of global escalation. I am not suggesting WW 3 but intensified conflicts between the Great Powers. This means more fragmented supply chains and more challenging access to energy and materials, and as we know, China is the largest net importer of many commodities.
The global disorder is here to stay. Therefore, escalating conflict between the Great powers is probable. WW 3 is a possible scenario, far from plausible and probable, yet it is not that far to ignore it. The Chinese ruling class knows that better than I do. CCP is aware that the supply of energy and materials can change the course of a war, whether it is cold or hot. Therefore, another round of fiscal stimuli will help the CCP build its inventories and boost the economy.
Monetary and fiscal measures mean growing demand for major bulk, hence rising tonne-mile demand for dry bulk carriers. In summary, the risk of a weaker Chinese economy is relatively low for the next few quarters.
Financial risk
The financial risks borne by Capesize owners are tightly related to China. Except Himalaya, all companies on the list have balance sheets with total debt/equity below 100%. In case of weaker TCE rates, they will have no issues serving their debts.
HSHP management took the bold step of ordering 12 brand-new ships. I believe the timing is great. Here, the case differs from Capital Clean Energy Carriers, for example. CCEC ordered 12 new LNG carriers with delivery dates between 2024 and 2027. The LNG carrier's order book is 54%, while Capes's order book is 7.2%. Besides that, HSHP’s ships have already been delivered, unlike CCEC’s.
There is always a chance that my view on China is wrong and the Chinese economy tanks into a deep recession. This would result in a steep bear market for commodities and dry bulk vessels. To recap, the Capesize segment's upside potential exceeds the downside risk of the weak Chinese economy.
The other contenders have relatively unleveraged balance sheets. This means they can tolerate large declines in TCE rates without adversely affecting their ability to service their debts.
Operating risk
In the previous section, HSHP bore the highest risk. Here is the opposite. The company has brand new ships. This means the operating risk is close to zero.
The riskiest company here is SHIP. Its fleet has an average age of 13.4 years. After the 10th year of the ship's life, the frequency of maintenance and, most importantly, unexpected breakdowns increase significantly. This leads to lower fleet utilization and higher OPEX.
SBLK and GNK fleets have an average age above 11 years. They have one advantage: a higher number of ships compared to SHIP. However, this fact does not mitigate the impact of age. It simply reduces the effect of taking one vessel out of service. It is one thing to have 17 ships, one of them in dry dock, and another to have 50 vessels and one in dry dock.
From all the discussed risks, China is the variable closely to follow. The CCP decisions in the coming quarters will confirm or nullify my Cape long thesis.
Conclusion
The Capsize market is still the place for investors excited about dry bulk shipping. The ship supply is limited and should stay so at least until 2026. On the other hand, the tonne-mile demand is propelled by strong macro tailwinds.
Choose your player according to your goals, skills, and risk tolerance.
Everything described in this report has been created for educational purposes only. It does not constitute advice, recommendation, or counsel for investing in securities.
The opinions expressed in such publications are those of the author and are subject to change without notice. You are advised to do your own research and discuss your investments with financial advisers to understand whether any investment suits your needs and goals.

