Demography is destiny. A robust population structure (or lack of) predetermines the future of countries and industries. It is a long-term predictor for supply shifts in labor-intensive businesses. Talking about such shipbuilding is an illustrious example.
Merchant ships are the world's largest factory-produced product. A 30,000 dwt Handysize bulk carrier contains about 5,000 tons of steel and 2,500 tons of other components (main engine, cables, piping, furniture, fittings, etc.). This industry is extremely complex and requires a large pool of highly skilled labor.
Three countries dominate the shipbuilding landscape: China, South Korea, and Japan.
What do all three share in common?
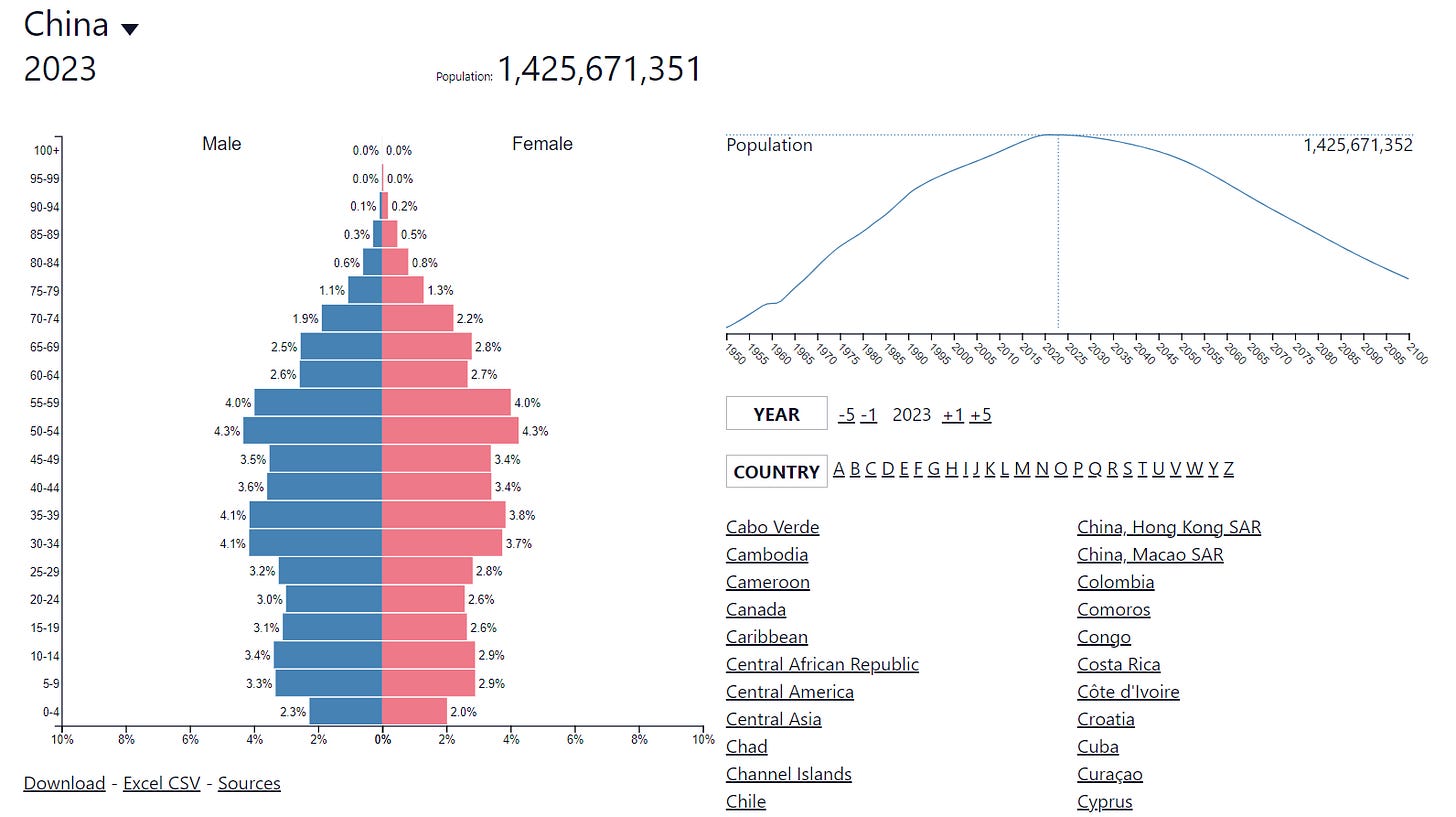
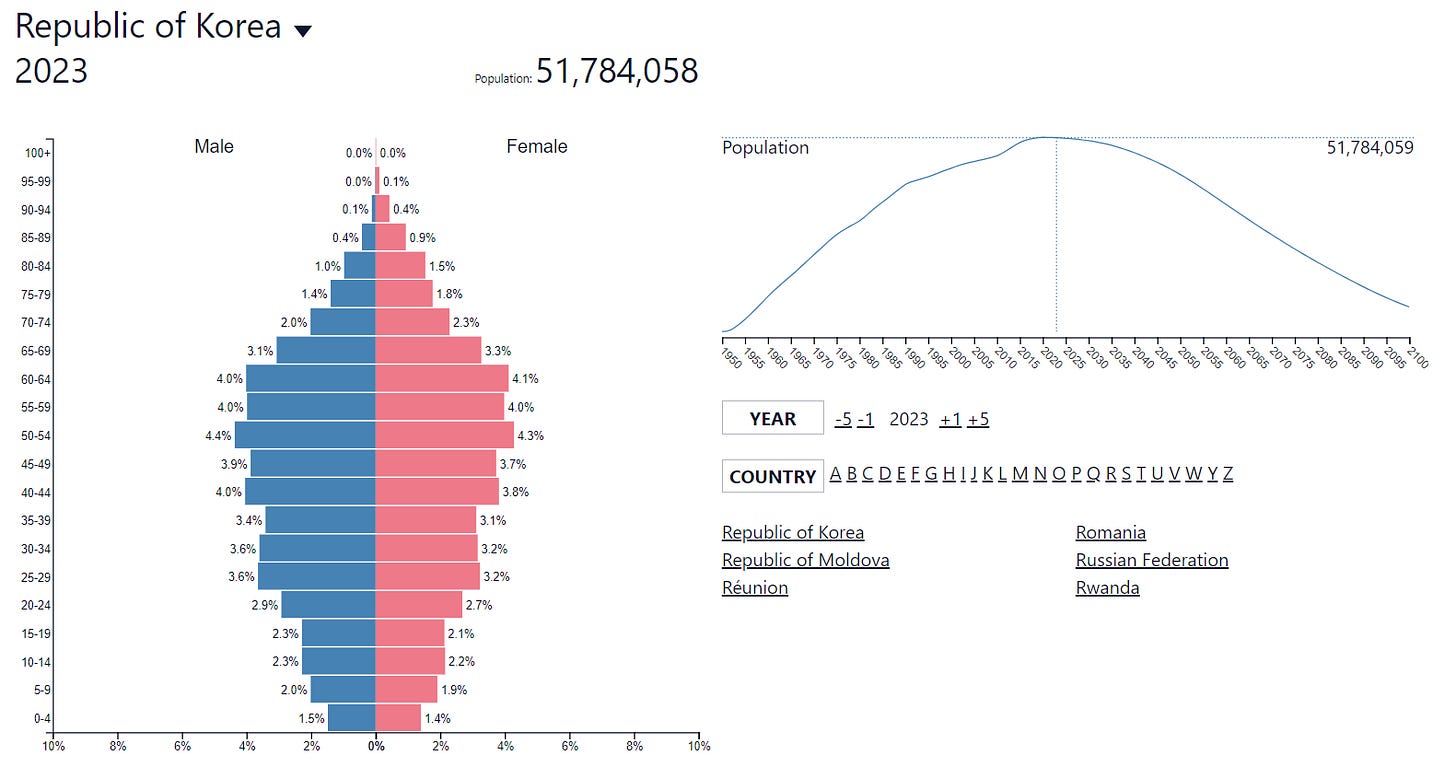
A declining population. Charts via PopulationPyramid.net
Let’s take South Korea. It has one of the lowest fertility rates in the world. The population needs a fertility rate above 2 to be sustainable. For South Korea, it is below 1. This will seriously affect the country and the world economy even in the present decade.
Unlike in the automotive industry, where robotization is happening tremendously, shipbuilding takes more time and effort. The reason is simple—a ship's scale is smaller than a car's. Replacing manpower with robots will eventually happen, but at a slower pace. Demography will affect shipping in the coming years. Of course, the effect will not be the same for all ship classes.
It’s time to venture into the shipbuilding industry. I document my trip in a series of articles. Today, we start with the basics—supply and demand dynamics.
Shipbuilding overview
Every shipowner considers four markets before making any decision:
· The market for new ships, i.e. shipyards
· The market for transport services, i.e. charterers
· The market for old ships, i.e., other shipping companies
· The scrap market, i.e., companies buying ships for scrap
Shipowner strives to balance between all four. For today’s article, we shift the agents' positions so that the shipyards are center stage.
Building a vessel takes 12-36 months, depending on size and complexity. Building a shipyard can take longer. Conversely, vessel demand is erratic depending on fluid variables like day rates and second-hand vessel prices. The need for vessels impacts the need for shipbuilding capacity. Simply put, shipyard supply is slower compared to vessel supply.
Shipbuilding, like shipping, follows cycles. Twelve of these cycles have occurred over the last 120 years, and I believe the 13th has just started. The average length of the cycle is 9.5 years, yet the standard deviation is 6.4 years. The shortest cycle lasted five years, while the most extensive was 25 years.
Geographically, shipbuilding unsurprisingly follows where the cheaper labor is. Of course, there has to be a balance between cost efficiency and man-hours per unit of output. The latter highly varies even nowadays. Nevertheless, the world has depended on the Far East for the last few decades to supply new ships.
Since the end of WWII, shipyards have moved from Europe and Scandinavia to Japan, then to South Korea, and eventually to China on a quest for lower labor costs. Now, China dominates the market measured in total output.
Concentration in one region does not imply that the shipyards are all equal. Shipbuilding enterprises vary in size and quality. Small shipyards are those with the capacity to build vessels up to 10,000 dwt and a headcount below 1,000. Usually, those companies specialize in building one or two types of ships.
Medium-sized companies can produce ships of up to 40,000 dwt. They have a workforce of about 1,500 people. Their product line could be more diversified compared to small yards.
The largest shipyards can build VLCC tankers, Capesize bulkers, and >10,000 TEU container ships. They also have the capacity and know-how to produce highly complex ships such as LPG and LNG carriers. Such companies rely on a large workforce, sometimes above 10,000 employees.
After a brief review of the industry, let’s see what it means to build a ship, measured by its cost. The new build price is divided into two main components: 45% labor and 55% materials. Those are subdivided into categories:
Labor costs: overhead (28%) and labor (17%).
Materials: steel (15%), main engine (18%), major purchases (22%).
The value in brackets represents the component as a percentage of the total new building cost. Those figures vary within certain limits, so the values show the relative weight of each element.
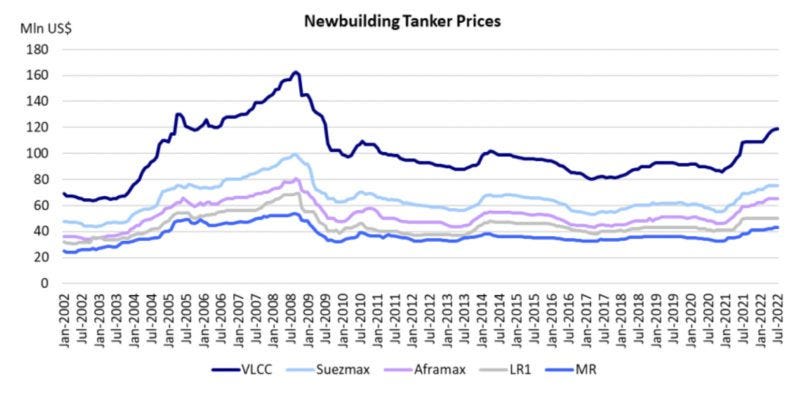
It is not enough that merchant ships are complex and challenging to produce, but their prices are inherently volatile. The two charts below show the new building prices for various vessels (via Fearnley’s weekly report) and the crude tanker prices during a 20-year period (via gCaptain).
The price swings are shocking. As a shipbuilder, you must deliver vessels with the same quantitative and qualitative characteristics while the reward shifts widely.
Shipbuilding demand has one curious trait. Let’s assume the global VLCC fleet is 1,000 vessels. The projected YoY demand growth is 5%, so 50 new tankers must be delivered in the next 12 months. In the meantime, however, 10% of the ships (100 tankers) reached 20 years of age and became eligible for scrapping.
Hence, the demand for new buildings is 15% (150 tankers), 5% to cover the growing need for new ships, and 10% to offset the old vessels planned for scrap. Even in a weak market, when the demand for ships collapses, the arrow of time keeps moving in one direction, i.e., the ships are getting older, and new vessels must be built.
When we are in the contraction phase of the shipping cycle, the prices of new ships abruptly decline, as seen in the chart above. Shipyards have to bite the bullet and build new vessels. Considering those facts, running a shipyard business is, at least to say, a challenge. This results in short prosperity for the shipyards, interrupted by long periods of struggle.
Supply and demand
Like shipping, shipbuilding is characterized by heavy short-term demand fluctuations and inelastic supply. However, shipbuilding supply is even more inelastic than shipping's.
Over the last fifteen years, all capital-intensive businesses have suffered from supply destruction. The reason is the well-known lack of CAPEX due to cycle contraction. I believe we are at the bottom of the cycle for energy, mining, and shipping (in broad categories). The same applies to shipyards.
Since 2008, the capacity declined by 65%. Chart via TideWater.
On the other hand, the queue for new vessels is getting longer, led by LNG/LPG carriers, container ships, and car carriers. Those three segments have double-digit order books exceeding 20%. Crude/product tankers, offshore supply, and dry bulk carriers are catching up, too. Those segments come with low teens or even single-digit order books.
The rise of the Global South, measured in population size and affluence, means ever-increasing energy and materials demand, resulting in rising maritime freight demand. On top of that, fossil fuels, iron ore, and bauxite supply grow on the West of Suez, while the demand East of Suez. The result is more tonne-mile demand, translating into the ever-increasing need for cargo vessels.
The price of a new ship depends on the number of available berths and the number of new orders. The more available berths compared to the orders, the lower the new building price and vice versa.
Let’s look at each side of the equation in detail.
The supply for shipbuilding capacity depends on the following:
· Cost of capital
· Cost of materials
· Cost of labor
· Exchange rates
· Subsides
All combined, determine the unit cost and the number of available berths.
Unit cost (the price of a ship) is a function of the cost of the inputs (labor, capital, materials). As pointed out earlier, new vessel prices are volatile, so shipyards may reach a point when they are losing money on vessel builds. Here comes the role of subsidies. They aim to absorb the negative difference between the vessel price and unit cost.
Exchange rates play a huge role, too. All three countries, Japan, China, and South Korea, have different economic policies regarding their currencies. Nevertheless, the role of domestic currency strength compared to the US dollar is indisputable.
Another aspect of shipbuilding supply is the supply chain. Since 2020, we have started to realize how important and fragile they are. Iron ore from Brazil and Wartsila marine engines from Finland must travel a long way to reach the Far East. The status of supply chains is the first derivative of geopolitical entropy. As a result, I expect more unexpected disruptions caused by growing global tensions.
The cost of labor deserves special mention. I started the article with demography. The population pyramids of China, Japan, and South Korea are no more pyramids. The declining workforce and the growing number of dependents undermine all labor-intensive businesses.
Moreover, mining, shipping, and energy are not attractive to the youth. China is an expectation. It takes years to develop a skilled labor force. Besides that, managerial positions require extensive technical and leadership skills. A rare combination that takes decades to nurture. The subsidies can offset the losses by reducing the costs, but they cannot create new naval architects, engineers, mechanics, and fitters overnight.
The demand depends on:
· Freight rates
· Second-Hand vessel prices
· Market sentiment
· Access to financing
There is a simple heuristic about the relationship between freight rates and new-build demand: The higher the day rates, the more ship orders. During the expansion phase of the shipping cycle, shipowners go on a shopping spree for new vessels. However, the delivery usually takes more than 24 months.
So, if shipowners want more ships now to capitalize on rising rates, they must venture into the second-hand market. With increasing day rates, the appeal of the second hand ships grows. An old vessel delivered today may cost more than a new ship delivered in two years during a market peak. Vessels of scrap age (above 20 years) are kept in operation, too, as long as the day rates are strong.
And here is the tricky part. The shipowners must reflect on the future. They may order new ships if they expect stronger rates in years to come. On the other hand, the shipowners are not confident in the long term, yet they still expect robust rates in the short term, so a second vessel is a plausible solution. The dominating narrative among the shipping companies creates expectations. Accordingly, the shipowners do not play only market fundamentals but expectations, too.
Access to financing is the last variable that determines the shipyard's capacity demand. This variable has two aspects: the cost of capital and banks' tendency to finance ship purchases. The cost of capital depends on interest rates, and banks’ tendency to fund shipping companies depends on interest rates, shipping market expectations, and shipping market fundamentals.
The shipbuilding industry is truly curious. It stimulates my obsession with asking questions. Some accessible findings, like General Dynamics or Mitsubishi Heavy Industries, seem appealing. Nevertheless, they are not what I am looking for.
General Dynamics is one of the largest defense contractors in the US DoD. The company builds nuclear subs and destroyers and owns Gulfstream Aerospace. So, General Dynamics follows market dynamics that are different from merchant shipyards. On the other hand, Mitsubishi Heavy Industries is not a shipbuilding pure-play. Shipping represents less than 40% of the company's revenue.
Today’s article is the first record of my journey in the shipbuilding industry. In the next chapter, I will share what ideas I found attractive and, most importantly, actionable.


Excellent primer on shipyards. Can’t wait to read part 2!
1MZ & 5E2 ... 🇸🇬 😬