We treat non-linear problems with linear thinking. Then, we complain about why we achieved the same results as the majority. Ignorance at epic scale.
I have been there, and I know it from experience. One of the most important lessons the market taught me is that whatever we do, we must maximize our chances of winning and risk reward. To summarize, to think about time and probabilities.
Time is the ultimate equalizer. Even chaos is a function of time. So, ignoring the role of time is at our own peril.
As investors, we wager on the outcome of future events, and the future is, by definition, unknowable. This means we rely solely on probabilities.
This is Part 2 of my technical analysis series. It is the abstract chapter where I discuss time and probabilities.
Time
In markets, time has two aspects: duration and flow.
We have three types of trends:
Short-term: lasting a few weeks to a few months; fundamentals hardly matter; the current consensus drives price.
Medium-term: lasting from a few months to a year; follows the fundamentals but also the consensus among market participants;
Long-term: lasting several quarters to several years; influenced by economic fundamentals;
In each period, the price is influenced by fundamentals and the expectations of market participants, i.e., the narrative.
Noise and signal as a function of a time frame
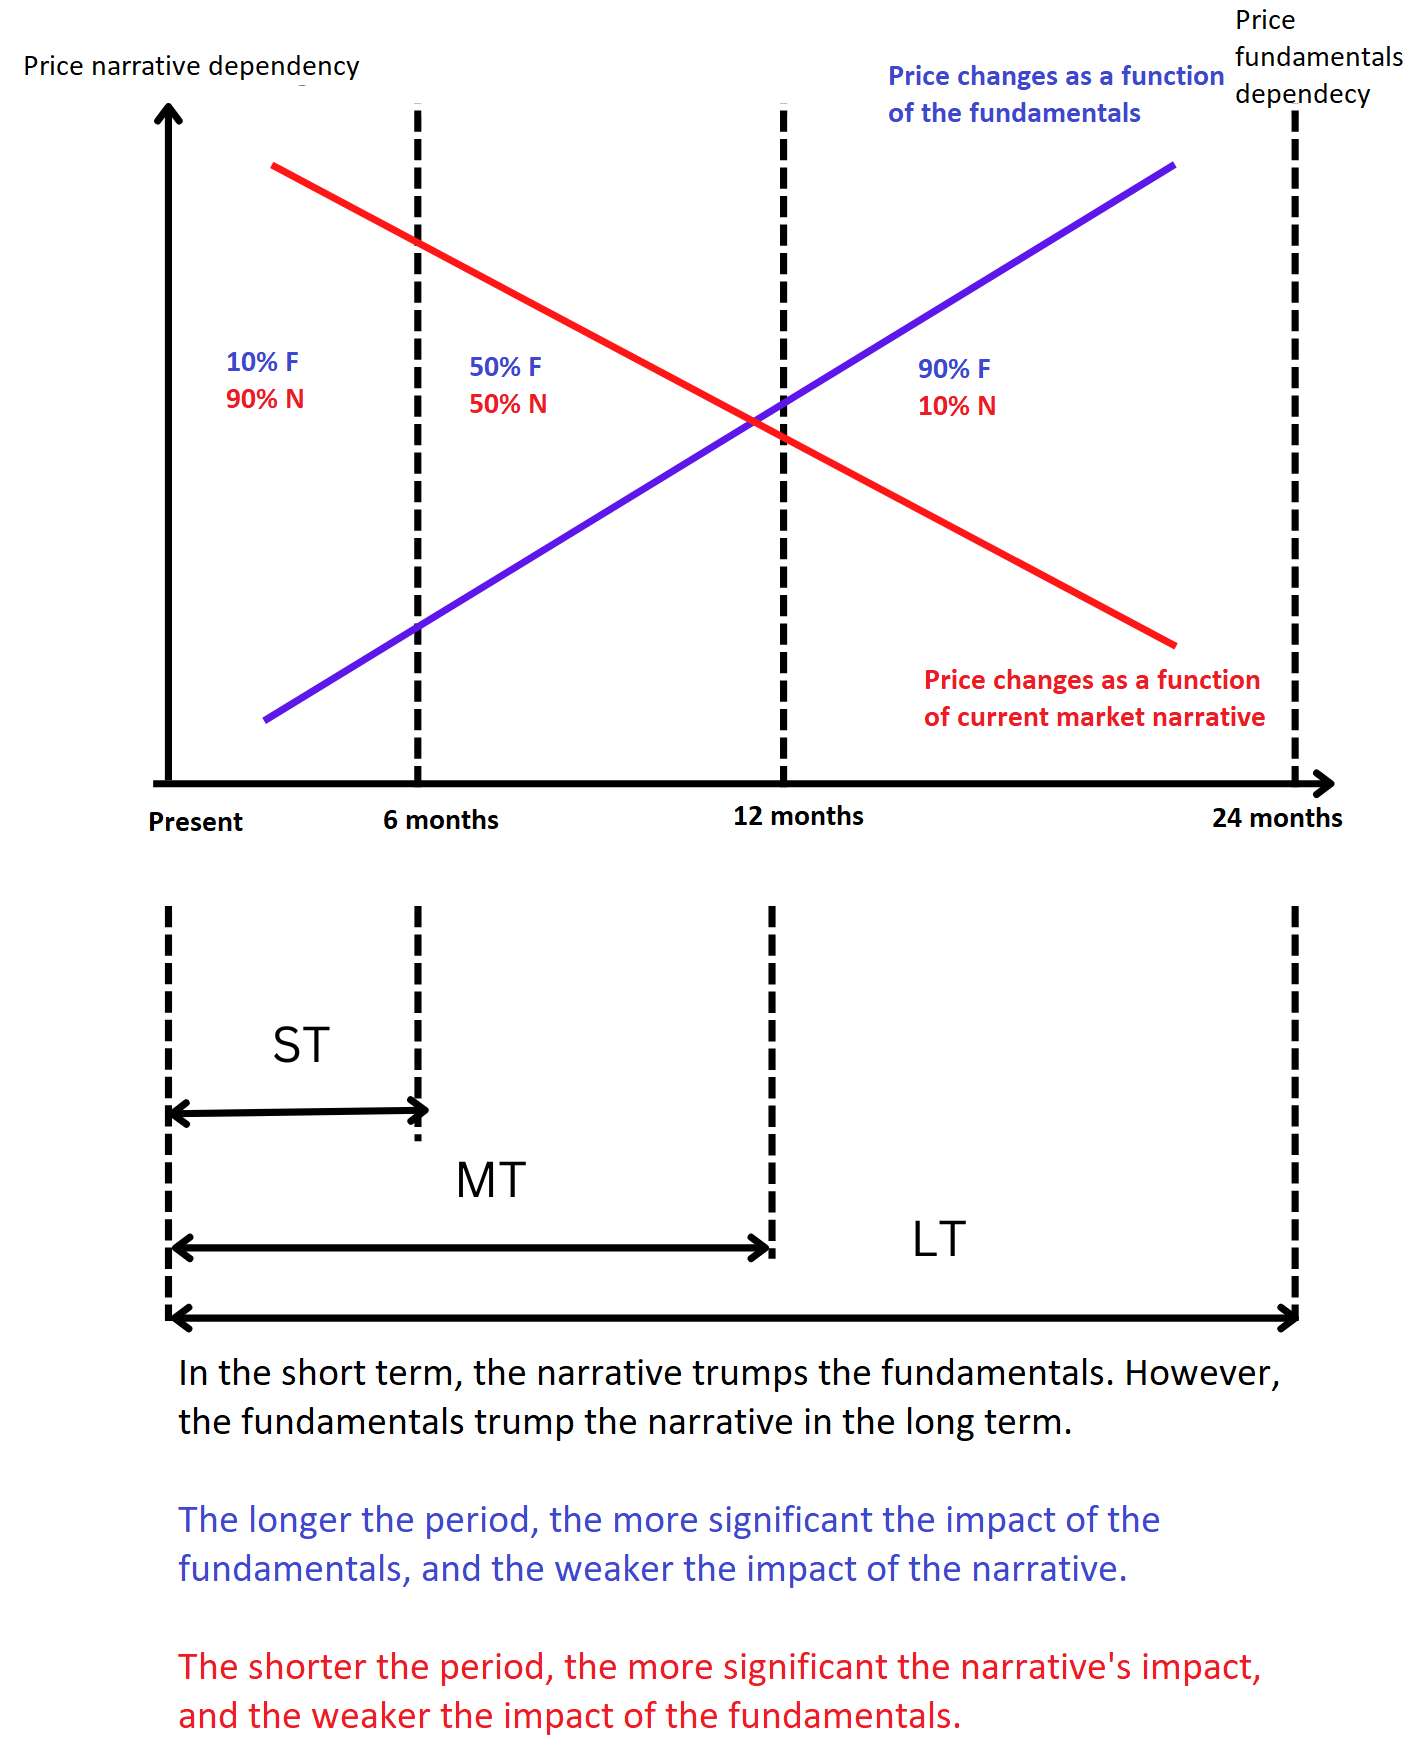
It is all about signal and noise. Fundamentals are the signal, and noise is the prevalent consensus among market participants. The following chart illustrates the relation between price and narrative and price and fundamentals.
The tide is a great analogy. Market fundamentals are like gravity and the moon: irreversible, omnipotent, and always in play. However, their impact is tangible in the longer term, i.e., beyond 12 months.
At the same time, the medium-term (6 months to 12 months) fundamentals are mixed with noise. In this time frame, the signal has not yet been totally silenced. Fundamentals are partially influencing price movements.
In the short term (week to 6 months), the factors driving the price are 90% noise and only 10% signal. In this situation, macro and fundamental analysis give more wrong than right conclusions.
Time frames are like matryoshka—the big contains the smaller within itself. The long-term trend includes the medium-term and the short-term. However, the short-term does not include the other two.
That is why long-term trends are the most powerful. They depend on the fundamentals and do not care about the consensus among market participants. However, the shorter the time horizon, the more the psychology of the crowds matters, and the fundamentals take a backseat.
This observation has implications for how we analyze price movements. The longer the period we consider, the more plausible the conclusions: a simple rule is that the higher the frame, the lower the noise-to-signal ratio.
On the charts below daily (hourly and minute), there is more than 90% noise—high-frequency trading algorithms reign supreme. Additionally, the majority of retail investors focus on short-term trades. On these timeframes, there is extreme competition, which results in noise. All of this creates unstable patterns to exploit.
On higher time frames, especially weekly and monthly, there is more signal and less noise. Price action is driven by large institutional investors—pension and mutual funds. They invest slowly yet decisively, fueling long-term trends. There is almost no competition—the signal is clear and intense. Weekly and monthly charts show the significant capital transfers expressed in the continuous trends.
For the above reasons, I use weekly and monthly charts.
Too often, our forecasts diverge on different time horizons. In the short term, we may be bulls; in the medium term, we may expect a range; and in the long term, we may be bears. The stars have aligned in our favor if we have three out of three - matching views for each time frame. So, the probability of being right increases; accordingly, we can bet big on our hypothesis.
However, such scenarios are rare. In most cases, we have two or one out of three. Even in the best case, the success is optional. There is no other way. Remember, we wager on future events. Eventually, those events become present and then past.
The flow of time
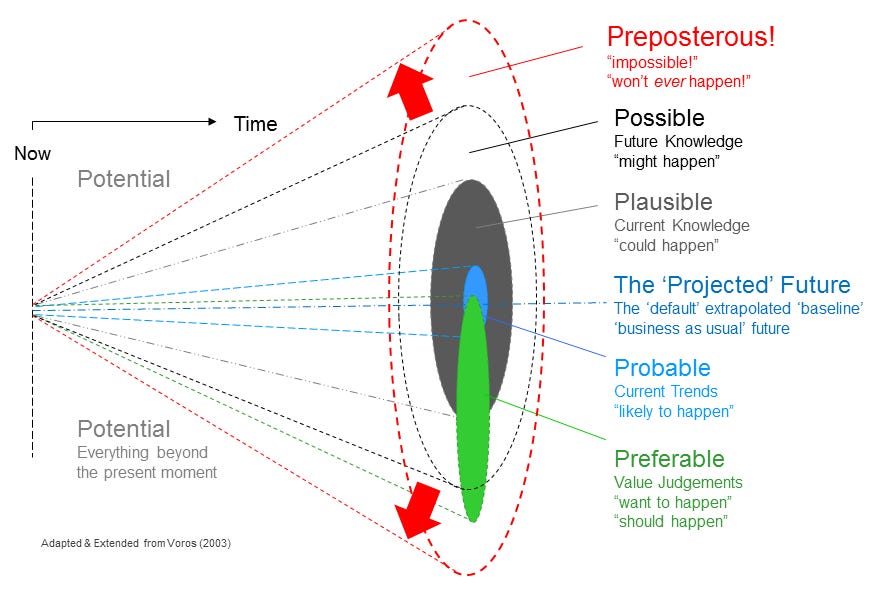
We perceive time as static. Wrong. Time is an eternal flow. The future becomes the present, and the present becomes the past. Look at the following graph.
This image conveys a disturbing yet powerful message. It tells us that all past paths are closed and knowable while the future ones are open and impenetrable. Most importantly, the veil of the future moves in one direction: the number of past paths grows to the detriment of the future paths.
The same is true in investing. We look at our past trades and confidently explain the reasons behind their outcome. However, we do not have a clue when we face the future. Think about every trade you take, like the green dot marking “your life today.”
From that perspective, we face a multitude of possibilities. How, then, do we examine future scenarios?
Time is part of the equation. The next one is probabilities, even though they do not exist in a vacuum. Probabilities define one essential characteristic of our thesis: credibility.
How credible is our thesis?
By definition, the future is unknowable. In the financial markets, we operate in a constant state of uncertainty. Our task as Risk Managers is to build scenarios for the future. Pay attention—not predictions or forecasts—they give false confidence in a reality where the only thing guaranteed is uncertainty.
The credibility of each scenario is based on how well we know the following three inputs:
Causes
Consequences
Probabilities
We may never know everything about all three. We assume we know something and build a hypothesis based on those assumptions. This hypothesis aims to be as reliable as possible, not to guarantee anything.
The scenarios can be classified according to the level of credibility as follows:
Potential or preposterous: scenarios that exist in the realm of the unknown unknown that we often, through ignorance, call impossible. We know neither the possible causes nor the magnitude of their consequences nor their probability of occurrence. Yet such events exist.
Possible: scenarios for which we know one of three - causes, consequences, probabilities. They are in the realm of the known unknown. Scenarios falling in that category have some level of credibility.
Plausible: scenarios for which we know two of the three variables—cause, effect, and probability. We have an idea of the possible combinations between the market variables. The degree of credibility is higher compared to the previous category.
Probable: scenarios that are based on our knowledge of the three factors - cause, effect, and probability. These are scenarios where the available information is more than what is missing. The credibility of these scenarios is highest compared to the other three.
A “probable” scenario does not guarantee certainty. Even those scenarios have blind spots. This comes true when we seek to estimate probabilities, but more on that later.
The graph below shows the relationship between the described scenarios.
Note that each successive scenario (from the center to the periphery) encompasses all the previous ones. Probable scenarios are also plausible, possible, and potential. However, potential scenarios are not probable. As investors and traders, we look for scenarios in the latter two categories (probable and plausible) - their credibility is relatively higher than the others.
How do we estimate scenarios’ credibility? By researching causes and effects and measuring the probabilities. This is easier said than done, especially probability estimation. So, let’s say a few words about probability.
Probabilities of being right and wrong
The market is an open self-emerging system with an (in)finite number of independent agents. Seeking precision, in that case, is the least to say, wasted effort. What we need is relative probabilities. Simply put, the chances of being right exceed that of being wrong.
Here comes the role of event-driven investing and price action. Below is a quote from my article on event-driven investing.
A complete investing thesis must have three components: macro tailwinds, robust company fundamentals, and the catalyst.
A powerful analogy is the Triangle of Fire. To start a combustion, we need oxygen, fuel, and spark. The macro tailwinds are the oxygen, the company fundamentals are the fuel, and the catalyst is the spark that ignites the fire (or the stock price, in our case).
So, a highly anticipated event is our spark. It tells us two things. First, we know that there is a spark, i.e., there is an event that will lead to stock revaluation. Second, it tells us when that will happen. This is the proverbial timing.
Of course, not all sparks are the same. There are two major types:
· Fixed event: events with a known exact date, such as elections, court decisions, or corporate actions.
· Broad event: events with a known time frame, i.e., months or weeks, such as demand/supply shifts in commodities, anticipated political decisions, or military conflict.
Having a catalyst event tells one more thing: the probabilities of being right are relatively higher than that of being wrong.
What about price action?
Let’s look at Navios Maritime’s monthly chart:
The confirmed breakout above $35/share signifies a phase transition from balance to imbalance. Here is a quote about phase transitions from Part 1.
In each market and time frame, the phase transition imbalance - balance - imbalance is observed. The result is trends-expansion-impulse followed by range-contraction-consolidation. The latter is recognized as chart patterns—rectangles, heads and shoulders, triangles, cups, and handles are some examples.
Phase transitions are a powerful tool that tells us when the odds are tilted in our favor.
Moreover, we crack the probability distribution by seeking phase transitions and event-driven ideas. What does this mean?
How to get it right or at least less wrong?
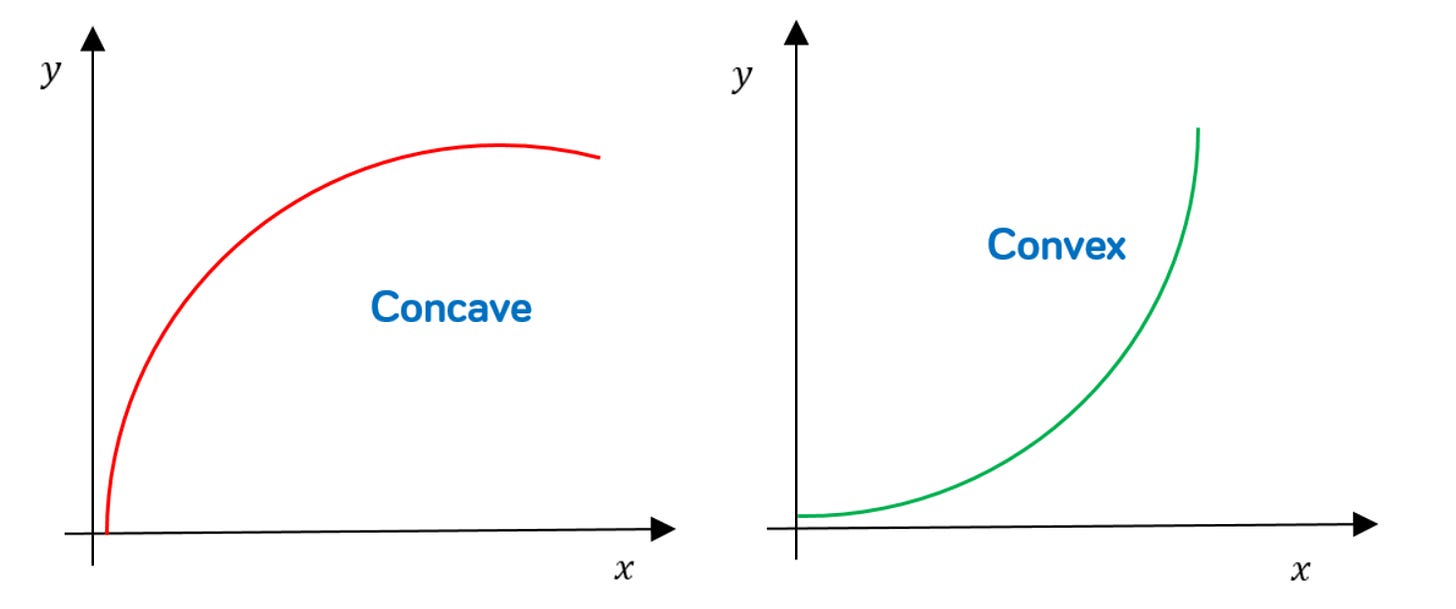
The left chart shows an idea without a catalyst and/or phase transition signal, and the right one shows an idea with a catalyst and/or phase transition.
On The X-axis, we have the anticipated price change; on the Y-axis, we have the probability of being wrong about the price. Usually, we assume the further we expect the price to go, the higher the chances of being wrong. This is true until we introduce catalysts and phase transitions.
In simple words, the probabilities of 10%, 25%, or 100% price change could be the same if we have a catalyst event and/or phase transition. Let’s give an example.
I forecast the price of Company XYZ’s shares to increase by 100% in the next 12 months. The catalyst is corporate restructuring plus favorable macro tailwinds. So, the probability of being wrong (and correct) about a 10%, 20%, and 100% price increase is roughly the same.
This pattern is explained by the fact that catalytic events usually provoke phase transitions. On the NMM chart, this was the announcement of Angeliki’s share purchase, future dividend, and buybacks. The 2024 March candle marks the phase transition. As seen, it is accompanied by abrupt and impulsive price action. In such scenarios, the price often reaches +100% for a short period.
Our goal is to research ideas that belong to the right chart—ideas with catalytic events and phase transitions. If we stay in the realm of the left graph, the probabilities of being wrong grow at the same rate or even higher as the expected price change. This is an unfortunate place to be in the long term.
By relying on catalytic events and phase transitions, the probabilities of being wrong rise significantly slower than the anticipated price move. Essentially, we get the kernel of investing right: risk-reward and odds.
Final thoughts
Investing means betting against gods. We try to predict the unpredictable. Nurturing temporal and probabilistic thinking is the only way to play that game.
Seek ideas with catalysts that would provoke a phase transition. Thus, we get the timing and odds right, or at least less wrong. This is the key to survival and potentially thriving in that game.
Time and probabilities are the core of every market strategy, and today’s article has just scratched the surface of this complex topic. Use it as a guide in the neglected world of risk management.
If you like to read more about time and its implications for investors, take a look at the articles below:
Everything described in this report has been created for educational purposes only. It does not constitute advice, recommendation, or counsel for investing in securities.
The opinions expressed in such publications are those of the author and are subject to change without notice. You are advised to do your own research and discuss your investments with financial advisers to understand whether any investment suits your needs and goals.


The more efficient the market becomes in the short-term, the more opportunities we'll have in the long-term. Recently, oil, copper, and PGMS were priced like demand was going away. I bought oil, copper, and PGMs options and stocks and planned to hold for the long-term. Then both the short and long-term aligned. I messed up my timing and sold too much too early, but I still had outstanding returns. If I did it the opposite, buying based on short-term only, I could have lost almost all of it.
Very well done.