It’s time for another trip in the nanocap shipping universe. The best ingredients are already here: share dilution, obscure reporting, lavish compensations, and questionable owners. Nevertheless, occasionally, there are opportunities.
In Part 1, I discussed crude and product tanker dynamics. In Part 2, I shared my take on two small tanker companies, Imperial Petroleum and Top Ships. It’s time to move on to the other major shipping segment: dry bulk cargo.
So, another two chapters are coming. Today, I review bulk carriers' market dynamics, and in the following article, I will dig into some nanocap bulk carriers companies.
I published my take on Capesize market dynamics a month ago. In my opinion, large bulkers are the best play. Nevertheless, bulkers generally have similar fundamentals. In other words, dry bulk cement is an asymmetric opportunity for shipping investors.
Bulk Carriers Supply
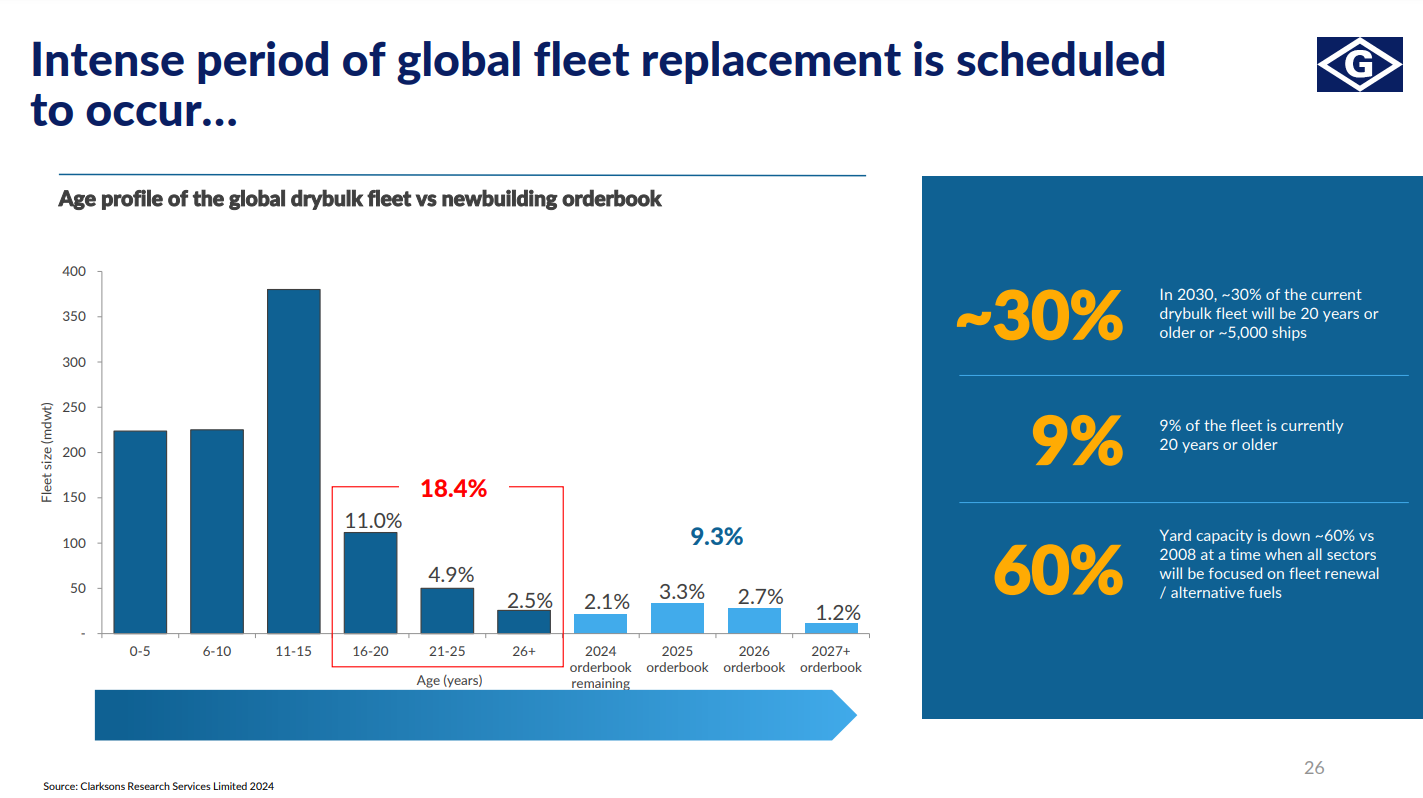
At its peak in 2007/2008, bulk carriers' order book reached 110%. Nowadays, it is in the single digits, and the global fleet is aging progressively. Chart via Genco Shipping.
18.4% of the global fleet falls in the 16-30 age category, while the order book is 9.3% for the next 48 months. Moreover, about 30% of the current bulk carriers’ fleet will reach 20 years in 2030. The shipyards are preoccupied with building LNG/LPG carriers, car carriers, and containers, so bulkers are not a priority.
Bulkers represent about one-third of the total shipbuilding market, making them the second largest segment. Chart via MMR.
Chinese shipyards are ramping up to meet the growing demand. 1Q24 total orders grew by 59% compared to 1Q23, while shipbuilding output increased by 34.7%. China is the largest builder of dry bulk carriers. Chart via BRS Group.
Bulk carriers represent more than 30% of Chinese shipyard output measured in dwt. Nevertheless, in recent years, the focus has shifted to more complex projects such as LNG/LPG carriers and floating assets for the energy industry. As a result, the number of available slots is insufficient to cover the demand.
Order book, fleet age, and shipyard capacity are long-term factors impacting supply. Like the tide, they lift all boats. However, we have a short-term constraint, too. Reduced speed and port congestion are those variables.
The slower the speed, the longer the voyage measured in time. The more congested the port, the longer the voyage, too. As a result, the same number of vessels are employed for extended periods. The ships could be reemployed only once they completed the contract. Simply put, this limits further the supply.
The following charts represent global port congestion (top) and average speed (bottom). The blue line represents Capesize, yellow Handysize.
Capesize port congestion grew by 7% just for a few months. It does not seem too much. But let’s not forget the shipping industry is a complex system with many variables. Alternating only one parameter, even slightly, could create disproportionate consequences. In other words, a linear input could result in nonlinear changes in the output. So, a tiny increase in port congestion may lead to a much tighter bulkers supply.
Speed is another subtle factor that significantly impacts vessel availability. Until recently, speed was a function of day rates: the higher the rates, the higher the speed. It's not that simple anymore.
The clean energy transition impacts all industries, including shipping. Air emissions are an integral part of environmental regulations. They impose strict rules on shipowners regarding sulfur oxides and NOx emissions. New ships come with a last-generation engine designed with those limits in mind.
Older vessels can retrofit EGCS (exhaust cleaning system, more popularly known as scrubbers). Even if they do so, they cannot maintain high speed. The reason is air emissions. The efficiency of scrubbers is tied to the exhaust gas inflow, which depends on engine load. Air emission restrictions limit the engine load, resulting in lower ship speed.
In summary, we have all stars aligned for limited supply:
Long-term factors: single-digit order book, aging global fleet, limited shipyard capacity
Short-term factors: increased port congestions and lower vessel speed
Now, it is time to move on to the other side of the equation. Let’s examine the demand.
Bulk carriers demand
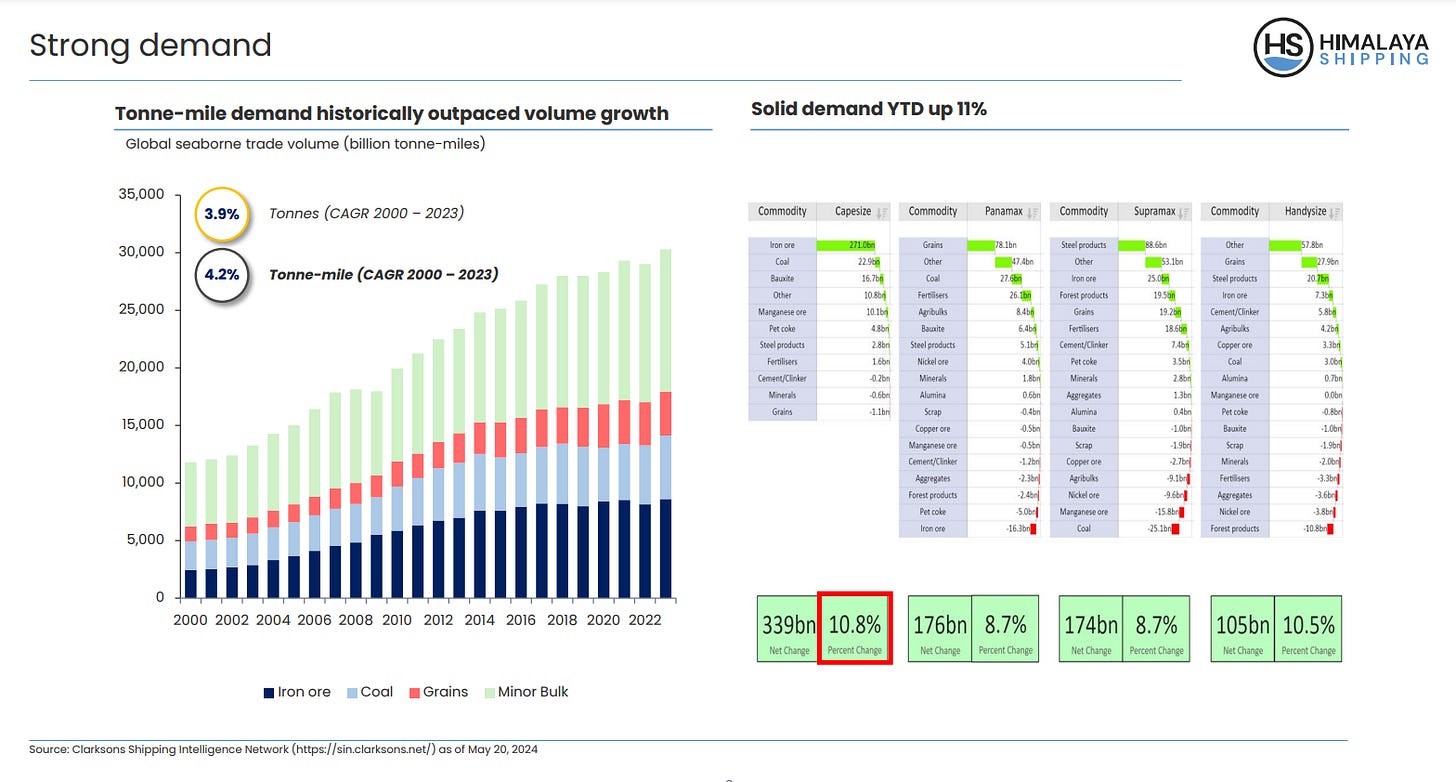
Let’s look at tonne-mile demand changes in major and minor bulks over the last 24 years. The chart below shows iron ore, coal, grains, and minor bulk tonne-mile demand (right) and the demand by type of bulk carrier and commodity. Chart via Himalaya Shipping.
Increased iron ore consumption mainly impacts Capsize demand. The other bulk carrier types depend primarily on minor bulks like cement, grains, copper, and steel. Demand across all segments is rising. Interestingly, the largest vessels (Capesize/Newcastlemax) and the smallest (Handysize) realized the highest YoY demand. Nevertheless, mid-size vessels also registered demand growth.
Capesize vessels primarily carry iron ore, bauxite, and coal, covering long distances from Brazil to China or Australia to China. Handysize ships cover regional trade routes, transporting minor bulk like grains, steel products, copper, and fertilizer. Normally, the Capesize and Handysize follow different patterns. Demand for large bulkers depends on the global steel demand (the need for iron ore and met coal), in other words, on China and India. The small bulkers, on the other hand, follow regional economic developments.
Final Thoughts
Shipping is an antifragile industry. The higher the global disorder, the more profitable it is. The Panama Canal situation is slowly improving, given that the water level in Gatun Lake is rising.
On the other hand, the Red Sea remains out of consideration. I believe the Israel-Gaza crisis may be resolved after the US presidential elections. I do not see the political will in the US administration's hawks to take decisive action earlier. So, I expect the Houthis to remain in charge of Bab el Mandeb traffic until December 2024 (at least).
In summary, the ingredients for an asymmetric bet skewed in our favor are here:
Constrained supply: low order book, aging fleet, limited shipyard capacity
Growing demand: China and India as the main major bulk consumers
Catalysts: rising geopolitical disorder disrupting the supply chains
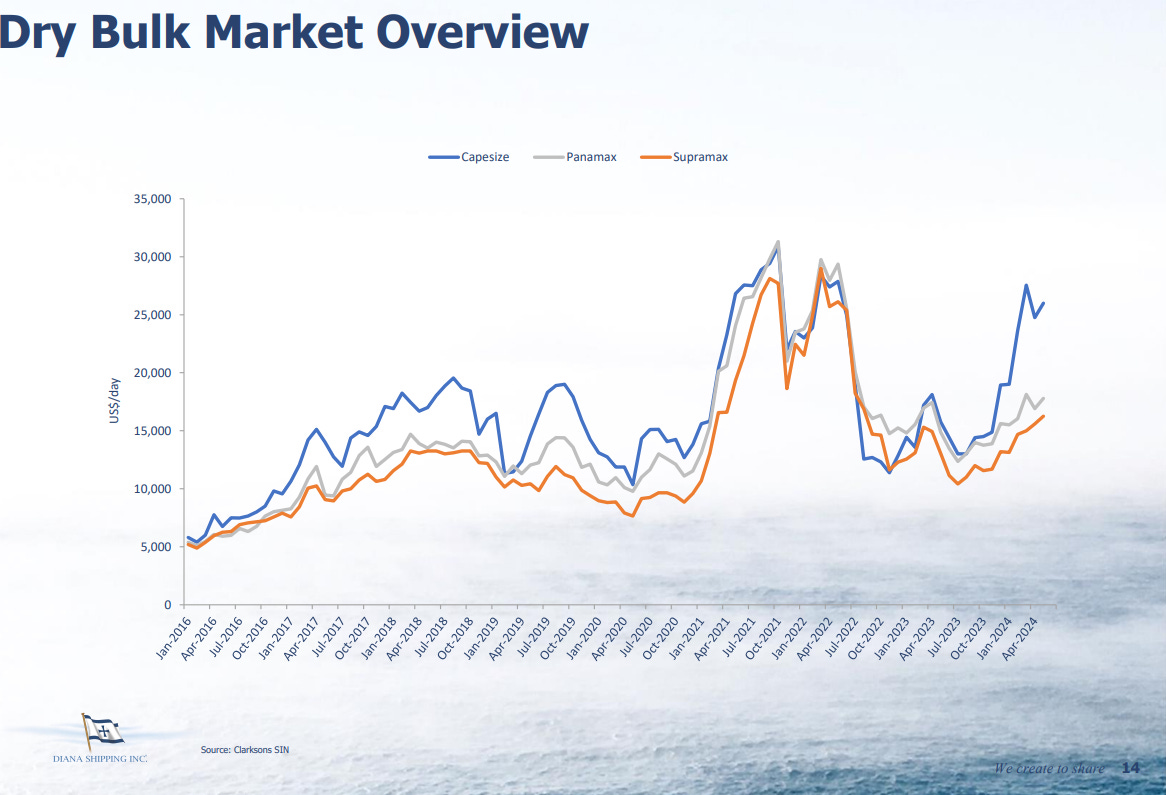
Vessel prices and day rates reflect the discussed dynamics. The graph below from Diana Shipping shows TC day rates for Capesize, Panamax, and Supramax.
The rates are unexpectedly strong, considering the impact of seasonality.
Not all bulk carriers are equal. In my opinion, Capesize offers the best risk-reward ratio. However, this is a nanochip universe. One new Capesize bulk carrier costs $77 million, the same as the market cap of the first three contenders combined. So, nanocap fleets mainly consist of smaller ships.
The companies in question are:
United Maritime Corporation
OceanPal Inc
Globus Maritime Limited
EuroDry Ltd.
Brace for another trip into the Greek shipping wonderland. Stay tuned.
Everything described in this report has been created for educational purposes only. It does not constitute advice, recommendation, or counsel for investing in securities.
The opinions expressed in such publications are those of the author and are subject to change without notice. You are advised to do your own research and discuss your investments with financial advisers to understand whether any investment suits your needs and goals.


Amazing Mihail! Only now I had time to read. You make it easy to understand the Dry Bulk Tesis!